

Think more funds means more safety? Think again.
Many investors stack funds and discover they own the same stocks and sectors twice or more.
That duplicate exposure raises fees, cuts real diversification, and blows up risk when markets drop.
The good news: checking holdings and cutting redundancy is mechanical and doable in 20 minutes.
This post lays out clear steps: grab factsheets, compare top holdings, use the minimum-weight overlap rule, then consolidate or replace funds, so your money buys true diversification, not repeat charges.
Immediate Methods to Detect and Reduce Fund Overlap in Your Portfolio

Fund overlap is what happens when two or more of your mutual funds or ETFs hold the same stocks, sectors, or asset types. You think you’re building diversification. Really, you’re stacking redundant positions. A portfolio with Rs 20,00,000 split evenly between two funds can wind up with 30.5% concentrated in technology stocks just because both funds favor the same sector.
That redundancy costs you. You pay separate management fees for duplicate exposure, cut down your real diversification, and ramp up concentration risk without meaning to. When market downturns hit overlapping positions, your portfolio drops harder than expected because what looked like five different funds was actually two or three exposures wearing different labels.
Checking holdings and cutting out redundancy is mechanical. You don’t need pricey software or advanced spreadsheet skills to get started. The simplest method compares top holdings across your funds and calculates how much they share.
-
Download the latest factsheet or holdings CSV for each fund. Most fund companies publish monthly or quarterly reports listing all portfolio positions and their percentage weights. Look for the “portfolio holdings” or “complete holdings” file, not just the top 10 summary.
-
List the top 10 to 20 holdings and their weights for each fund. Focus on the largest positions first. In most equity funds, the top 10 stocks account for 30 to 50% of the fund’s value, so overlap in this group matters most.
-
Identify common stocks across your funds. If SBI Bluechip and Kotak Bluechip both list HDFC Bank, ICICI Bank, and Infosys in their top three, you already know significant overlap exists before doing any math.
-
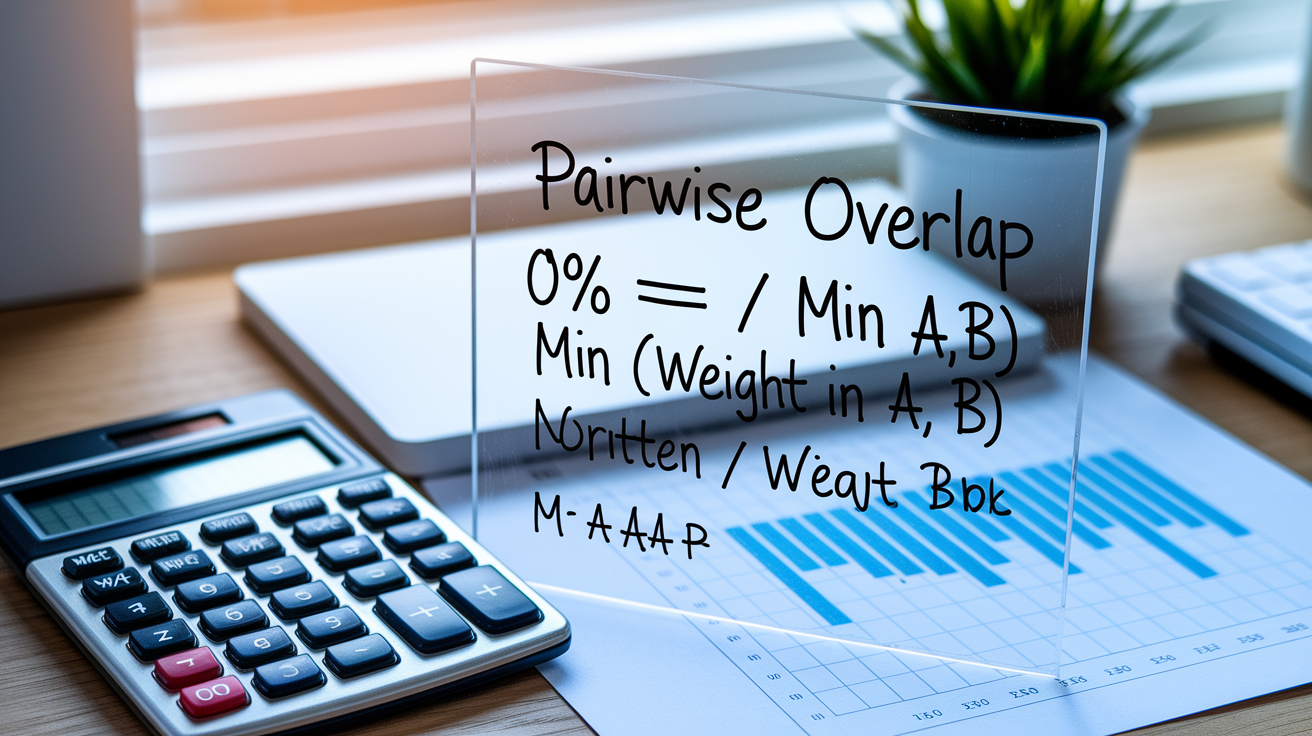
Calculate pairwise overlap using the minimum weight formula. For every stock that appears in both funds, take the smaller of the two weights and add them up. If Fund A holds Infosys at 6% and Fund B holds it at 5%, that stock contributes 5% to your overlap total. Sum these minimums across all shared positions to get your pairwise overlap percentage.
-
Apply a threshold to decide if action is needed. Overlap below 25 to 30% between two funds is typical for funds in the same category. Overlap above 40% is huge and usually means one fund is redundant. If you find 70% overlap, you’re paying two sets of fees for the same portfolio.
-
Check combined exposure to any single stock across your entire portfolio. Multiply each fund’s weight in your portfolio by that fund’s holding percentage in a given stock, then sum across all funds. If this combined exposure to one company exceeds 10% of your total assets, you’ve got unintended concentration that overlap created.
-
Review sector weights the same way. If three funds each hold 25% in technology and together they represent 60% of your portfolio, you end up with roughly 15% of your entire portfolio in tech stocks, possibly far above your intended allocation.
-
Document your overlap matrix and prioritize fixes. Keep a simple grid showing pairwise overlap percentages between all your funds. Start by addressing the highest overlap pairs first, either by consolidating into a single fund or replacing one with a fund that offers genuinely different exposure.
Understanding Key Types of Fund Overlap and How They Affect Redundancy

Overlap isn’t just about owning the same stock twice. It shows up at the security level, the sector level, and even in the investment style or factor tilt your funds follow. Each type dilutes diversification differently. Fixing one type doesn’t automatically fix the others.
Security overlap is the most visible and easiest to measure, but sector and style overlaps often hide beneath category labels that sound different.
Security Overlap
Security overlap means the exact same company appears in multiple funds. TCS, Reliance, HDFC Bank, Infosys, and Tata Motors are common examples in Indian equity portfolios. When your large cap growth fund, your flexicap fund, and your multi cap fund all hold Reliance at 4 to 6%, you haven’t spread risk across 30 or 40 different stocks as the fund count suggests. You’ve built a concentrated bet on a handful of mega caps. A single earnings miss or regulatory change can hurt all three funds at once. Two funds overlapping on 31 identical stocks out of 50 to 60 total holdings is a 47% security overlap. Nearly half your exposure is duplicated.
Sector Overlap
Sector overlap happens when different funds favor the same industries, even if the specific stocks differ slightly. If one fund holds Infosys and TCS while another holds Wipro and HCL Tech, both are concentrated in IT services. During a technology sector selloff, both funds will drop together. A portfolio holding Rs 10,00,000 in one fund and Rs 10,00,000 in another can end up with Rs 6,10,000 in technology stocks if both managers tilt heavily toward that sector. That’s 30.5% of your total assets in one sector, far beyond what a single diversified fund would hold and much riskier than you intended.
Style/Factor Overlap
Style overlap occurs when funds marketed under different labels follow similar strategies. A “quality” fund and a “growth” fund might both own the same large cap winners because quality metrics and growth characteristics point to the same companies. Factor tilts like momentum, low volatility, or dividend yield can also repeat across funds. You think you’re combining complementary approaches, but under the hood the portfolios look nearly identical. This overlap reduces the benefit of multi strategy diversification and leaves you exposed to the same market cycles and rotations.
Metrics and Formulas to Accurately Measure Fund Overlap
Measuring overlap requires turning holdings lists into comparable numbers. The most useful metric weights each position by size, so a 5% holding that appears in two funds counts more than a 0.5% position.
The standard pairwise overlap percentage sums the smaller weight for every shared security. If Fund A holds Stock X at 4% and Fund B holds it at 6%, Stock X contributes 4% to the overlap total. Repeat for all common positions and add them up. The result is the percentage of the smaller fund’s portfolio that duplicates the larger one. A 40% pairwise overlap means four out of every ten rupees in the smaller fund mirror holdings in the other.
Pairwise overlap % = Σ min(weight in Fund A, weight in Fund B) for all shared securities. This formula gives a single percentage that summarizes duplication between two funds.
Number of unique holdings. Count how many distinct stocks appear across all your funds. If you own five funds with 50 stocks each but only 80 unique tickers total, you’ve got significant repetition.
Portfolio level single stock exposure. For each company, multiply its weight in each fund by that fund’s weight in your total portfolio, then sum. If Company Z is 5% of Fund 1 (which is 40% of your portfolio) and 6% of Fund 2 (30% of your portfolio), your combined exposure is (0.05 × 0.4) + (0.06 × 0.3) = 3.8%.
Sector concentration index. Similar to single stock exposure but applied to industries. Helps reveal when “different” funds all tilt toward the same sectors.
Correlation coefficient (R²). Measures how closely two funds’ returns move together. High correlation suggests similar risk drivers, but it’s an indirect signal. Two funds can have high correlation without holding identical stocks if they respond to the same market factors. Use correlation to support overlap analysis, not replace it.
Overlap ratio on a position count basis. Divide the number of shared stocks by the total number of unique stocks. Quick but less precise than weighted overlap, because it treats a 10% position the same as a 1% position.
| Metric | What It Measures | When It’s Useful |
|---|---|---|
| Pairwise Overlap % | Weighted duplication between two funds | Deciding whether to consolidate or keep both funds |
| Single Stock Exposure | Total portfolio weight in one company | Spotting unintended concentration risk |
| Sector Weight | Combined allocation to one industry | Checking if diversification across funds is real or cosmetic |
Tool Based Strategies for Checking Fund Holdings and Detecting Redundancy

Online portfolio analyzers automate overlap detection and show results in minutes. These tools pull current holdings from databases, calculate weighted overlaps, and highlight concentration risks you might miss by hand.
Morningstar Portfolio X Ray is the most widely known. Input your fund tickers or ISINs, specify how much you hold in each, and the tool breaks down your combined portfolio by stock, sector, region, and market cap style box. It flags securities that appear in multiple funds and shows your effective exposure to each. Because it uses a global investment database, X Ray can drill through funds of funds and reveal the underlying stocks even when your fund invests in other funds. The sector and style analysis helps you see if “different” fund categories are actually giving you the same large cap growth tilt.
Portfolio Visualizer offers similar overlap reports plus correlation matrices and factor exposure. It’s especially useful for comparing ETFs because it updates holdings frequently and lets you backtest what your portfolio would have looked like with reduced overlap. You can model fund replacements before making changes.
Broker platforms and fund company websites increasingly include overlap tools in their account dashboards. Many let you input multiple funds or view your entire account as a consolidated portfolio, then generate reports showing top combined holdings, sector weights, and pairwise overlaps. Check your broker’s research or portfolio analysis section for these features.
-
Log in to the tool and add all your funds by ticker, ISIN, or fund name. Be precise with identifiers to avoid pulling data for a different share class or similarly named fund.
-
Enter the amount or percentage you hold in each fund. This weights the analysis correctly. A fund representing 40% of your portfolio should count more than one at 5%.
-
Run the overlap or portfolio analysis report. Most tools have a button labeled “analyze,” “overlap,” or “portfolio X ray.” The report will list all holdings across your funds, merge duplicates, and calculate combined weights.
-
Review the list of top combined holdings and sector allocations. Look for any single stock above 5 to 10% of your total portfolio or any sector above 25 to 30%. These are your concentration hotspots.
-
Check the pairwise fund comparison. Many tools show a matrix or table of overlap percentages between each pair of funds. Identify pairs with overlap above 40% and decide whether both funds are still necessary.
Manual Holdings Comparison for Investors Who Want Full Transparency

Tools are fast, but manual analysis gives you complete control and deeper insight into what you own. You see exactly which stocks overlap, at what weights, and on what date the data was published.
Start by downloading the full holdings file for each fund. Most fund companies post CSV or Excel files monthly or quarterly under “portfolio,” “holdings,” or “transparency” sections of their site. Regulatory filings and factsheets also list complete holdings. Make sure all your files share the same reporting date, or note the date differences so you’re not comparing stale data to fresh data.
Excel/Sheets Automation
Spreadsheets turn raw holdings into overlap calculations. Import each fund’s CSV into a separate sheet or combine them into one master table with a column identifying the fund name. Use VLOOKUP or INDEX/MATCH to find common tickers across funds. For each shared security, use a formula like =MIN(FundA_weight, FundB_weight) and sum the results to get your pairwise overlap percentage. To calculate portfolio level exposure, multiply each fund’s weight in your portfolio by its holding weight in a given stock, then use SUMIF to total exposure across all funds for that stock. Keep formulas simple and double check a few manually to catch errors.
Ticker or ISIN. Unique identifier for each security. ISINs are safer because tickers can be reused or differ across exchanges.
Security name. Helps you spot duplicates if tickers are missing or inconsistent (e.g., “Infosys Ltd” vs “Infosys”).
Holding weight (%). Percentage of the fund’s assets in that security. This is the core number for overlap calculations.
Sector or industry classification. Lets you group by sector and measure sector overlap separately from security overlap.
Market cap or asset class. Useful for verifying that funds labeled “mid cap” or “small cap” actually hold different stocks than your large cap funds.
Practical Thresholds for Deciding When Overlap Is a Problem
Not all overlap is bad. Funds in the same category will naturally share some top holdings, especially in markets dominated by a few large companies. The question is how much overlap crosses the line from reasonable to redundant.
Pairwise overlap below 25 to 30% is typical and usually acceptable for funds within the same asset class. Both funds still bring enough unique positions to justify holding both. Overlap between 30% and 40% deserves a closer look. Check whether the non overlapping portions add real diversification or just smaller, similar stocks. Overlap above 40% is a strong signal that one fund is redundant. At 70% overlap, you’re paying two expense ratios for what is basically the same portfolio.
-
Single stock exposure exceeds 10% of total portfolio. No matter how the exposure built up, concentrating more than 10% in one company is higher risk than most investors intend. Reduce allocation in one or more funds, or rebalance into funds that don’t hold that stock.
-
Sector exposure exceeds 30% without a deliberate overweight. If you didn’t intentionally tilt toward technology or financials but your combined funds put 35% of your money there, overlap has created unintended concentration. Shift allocations or replace a fund.
-
Pairwise overlap between two funds exceeds 40%. One of the two funds is likely unnecessary. Compare expense ratios, historical performance, and fund size, then consolidate into the better option or replace the weaker fund with one that offers different exposure.
-
Three or more funds share the same top five holdings. This pattern suggests all the funds are clustered around the same mega cap stocks. Diversification by fund count is an illusion. Consolidate or diversify across market caps, geographies, or strategies that don’t revolve around the same large companies.
Reducing Redundancy: How to Consolidate or Replace Overlapping Funds

Once you’ve identified overlap, fixing it means making deliberate choices about which funds to keep, which to trim, and what to add for real diversification.
Consolidation is the simplest fix when two funds overlap heavily. Pick the one with lower fees, stronger long term performance, or better tax efficiency, and move all the money there. If Fund U and Fund V overlap by 70%, keeping both means paying overlapping fees. Illustrated in one example as Rs 2,10,000 in fee impact on a Rs 6,00,000 combined holding. Merging into a single fund cuts that redundant cost and simplifies monitoring. When overlap sits inside tax advantaged accounts like IRAs or 401(k)s, consolidation is usually free of tax consequences, so there’s little reason to delay.
If you want to keep multiple funds for strategic reasons, replace the overlapping one with a fund that adds different exposure. Swap a large cap blend fund for a mid cap or small cap fund to reduce same stock duplication. Replace a US focused equity fund with an international or emerging market fund. Shift from an actively managed fund that happens to track the index closely into a low cost index fund, freeing up capital to add a sector, factor, or thematic fund with genuinely different holdings.
Consolidate into the lower cost fund when overlap is above 50%. Fees compound over decades. Cutting duplicate expense ratios by even 0.5% improves long term returns.
Replace one large cap fund with a mid cap or small cap fund. Smaller companies rarely overlap with mega cap portfolios, instantly reducing security level redundancy.
Add international or emerging market exposure. Geographic diversification cuts overlap in domestic stocks and spreads risk across different economies and currencies.
Use index funds or ETFs for core allocations. Passive funds that track broad benchmarks give predictable, low overlap exposure. Pair them with smaller allocations to active or thematic funds for targeted bets.
Separate growth and value styles deliberately. Growth and value stocks usually don’t overlap much. A value tilt fund combined with a growth fund covers more ground than two growth funds that duplicate the same momentum stocks.
Review fund objectives and constraints. Some funds have mandates that force overlap (e.g., large cap only rules). Mixing funds with different mandates reduces the chance they’ll cluster in the same stocks.
Managing Overlap Across Taxable, Retirement, and Employer Accounts

Overlap often hides when your money is split across multiple account types. Your 401(k) might hold a large cap index fund, your IRA a similar large cap ETF, and your taxable brokerage a third large cap mutual fund, each managed separately but all owning the same stocks.
To see the full picture, aggregate every account into one view. Use account aggregation features in portfolio tools or manually export holdings from each account and combine them in a spreadsheet. Many overlap problems only become visible when you treat all accounts as a single portfolio. A stock that looks like 3% of your 401(k) and 4% of your IRA might be 8% of your total net worth when combined.
Tax considerations shape how you fix overlap across account types. Inside retirement accounts, you can sell and swap funds without triggering capital gains, so consolidation is straightforward. In taxable accounts, selling a fund with large embedded gains creates a tax bill. Prioritize trades inside IRAs and 401(k)s first, then handle taxable accounts more carefully. If you need to reduce overlap in a taxable account, look for tax loss harvesting opportunities. Sell a fund with losses to offset other gains, but watch the wash sale rule. The IRS disallows the loss if you buy a “substantially identical” security within 30 days before or after the sale. Replacing one large cap fund with another very similar large cap fund can trigger a wash sale, so plan replacements that add genuine diversification rather than swapping near clones.
Creating a Long Term Monitoring System to Prevent Fund Overlap From Returning
Detecting overlap once isn’t enough. Fund managers change holdings, new funds enter your portfolio, and account balances shift with contributions and market moves. Without ongoing monitoring, overlap creeps back in.
Set a quarterly review cadence for most portfolios. Every three months, download updated holdings or refresh your portfolio analyzer tool, recalculate pairwise overlaps, and check combined exposures to top stocks and sectors. Quarterly reviews catch significant changes without creating unnecessary work. If you trade frequently or hold actively managed funds that rotate positions often, consider monthly checks.
Download the latest factsheet or holdings file for each fund. Verify the data is current. Stale holdings from six months ago won’t show recent manager changes.
Recalculate pairwise overlap for all fund pairs. Update your overlap matrix. Flag any pairs where overlap increased by more than 10 percentage points since the last review.
Check top 10 combined holdings. List the stocks with the highest total exposure across your entire portfolio. Confirm none exceed your single stock threshold (typically 5 to 10%).
Review sector and style box distributions. Make sure your allocation across sectors and market cap styles still matches your plan. Drift here often signals rising overlap.
Set alerts or reminders. Use calendar reminders or portfolio tool alerts to prompt reviews. Automated alerts can flag when a fund’s holdings change significantly or when a new fund is added to an account.
Style Drift Checks
Actively managed funds don’t always stay true to their label. A mid cap fund might drift into large cap stocks during a bull market, or a value fund might start chasing growth names. Style drift increases overlap with your other funds and changes your portfolio’s risk profile without any action on your part. Check each fund’s current market cap and value/growth positioning quarterly using a style box analysis. If a fund has drifted out of its category, decide whether to replace it or adjust other holdings to restore balance. Funds that consistently drift are harder to use as reliable building blocks, so consider switching to index funds or rules based strategies with tighter mandates.
Final Words
Start by downloading fund factsheets or CSVs and compare top holdings. Compute pairwise overlap using the min(weight) formula and flag pairs over 40%.
Use tools like Morningstar X-Ray or Portfolio Visualizer to speed things up, or do a manual Excel check for full transparency. Then apply thresholds and consolidation rules to fix big overlaps.
This post gave an action plan for reducing fund overlap: how to check holdings and avoid redundancy, plus a simple monitoring routine. Do the steps once, then review quarterly, and you’ll have a cleaner, more confident portfolio.
FAQ
Q: How to check portfolio overlapping in mutual funds?
A: To check portfolio overlapping in mutual funds, download each fund’s holdings, compare top 10–20 positions, compute pairwise overlap with sum(min(weight_i)), and flag overlaps above ~40% for review and action.
Q: What is the 15 * 15 * 15 rule?
A: The 151515 rule is a simple heuristic: review the top 15 holdings, aim to keep any single-holding overlap near or below 15%, and recheck every 15 months to catch drift or style shifts.
Q: What is the 7% rule in ETF?
A: The 7% rule in ETF investing advises keeping any single issuer or stock exposure around or below 7% of your total portfolio to limit concentration risk; use it as a guideline, not a strict law.
Q: What is the 5 25 rule for rebalancing?
A: The 5/25 rebalancing rule means rebalance when an asset class drifts by 5 percentage points from its target or by 25% relative to its target weight, whichever threshold is reached first.