

Think the highest-return fund is automatically the best?
The Sharpe Ratio measures how much extra return you earn for the risk you take.
It boils return and volatility into one number so you can compare funds with very different behavior.
This post shows how to calculate Sharpe, read what its values really mean, and use it to pick funds that fit your goals.
It won’t tell you everything, but it’s one of the clearest tools to spot efficient managers and avoid funds that make you sweat.
Understanding the Sharpe Ratio

The Sharpe ratio shows you how much extra return you’re getting for the risk you’re taking on. It’s one number that rolls up return and volatility, which makes comparing funds with totally different behaviors way easier.
William F. Sharpe built this thing in the 1960s to solve a pretty straightforward problem: two funds might both give you 10% a year, but one’s all over the place while the other just chugs along. Which one’s actually better? The Sharpe ratio answers that by measuring excess return (what you earned above something safe like a Treasury bill) and dividing it by standard deviation (how much the fund bounces around). Higher Sharpe ratio means you’re pulling more return out of each percentage point of volatility you’re putting up with.
Raw returns don’t tell you enough. A fund that jumps 15% one year and drops 12% the next might look fine on paper, but living through those swings makes it tough to stick with when things get messy. The Sharpe ratio captures that reality and lets you make decisions based on efficiency, not just headline numbers.
Investors lean on the Sharpe ratio for a few clear reasons:
Compare funds with different risk profiles without guessing which one’s really pulling its weight.
Figure out whether high returns actually justify high volatility or if there’s a smoother option sitting right there.
Spot funds that deliver solid results without forcing you onto a roller coaster.
Make smarter allocation calls by zeroing in on risk-adjusted efficiency instead of chasing the biggest number.
Formula and Components of the Sharpe Ratio
The formula’s pretty simple:
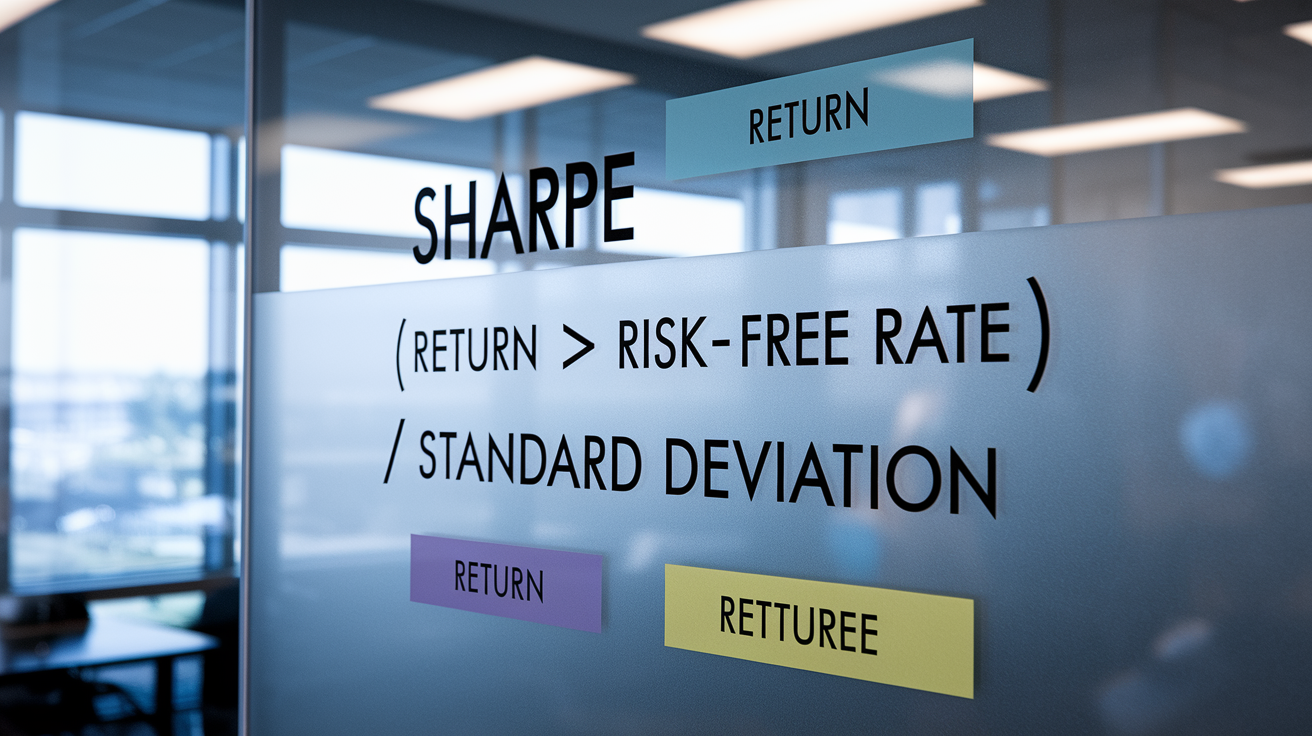
Sharpe Ratio = (Return of Portfolio − Risk-Free Rate) / Standard Deviation of Portfolio Returns
Each part does something specific. The return of the portfolio is the average annual gain (or loss) the fund posted over whatever period you’re looking at. The risk-free rate is what you could’ve earned in something nearly riskless, usually a short term U.S. Treasury bill. Subtracting the risk-free rate gives you the excess return, the premium you earned for accepting risk.
Standard deviation measures volatility. It tells you how much the fund’s returns jump around month to month or year to year. High standard deviation means bigger swings. Low standard deviation means calmer ride. When you divide excess return by standard deviation, you get how much return you earned per unit of that volatility.
The risk-free rate anchors everything. If Treasury bills pay 2% and your fund earns 8%, your excess return is 6%. If the fund’s standard deviation is 10%, your Sharpe ratio is 0.60. You earned 0.60 percentage points of excess return for every percentage point of volatility.
Here’s how you actually do it:
- Grab your fund’s average annual return (say, 8.0% over the past five years).
- Find the current risk-free rate (maybe the yield on a 3 month Treasury bill, let’s say 2.0%).
- Subtract the risk-free rate from your fund’s return (8.0% − 2.0% = 6.0%), then divide by the fund’s standard deviation (if standard deviation is 10.0%, Sharpe = 6.0% / 10.0% = 0.60).
Standard deviation’s always a percentage and has to match the same timeframe as your returns. Annual returns need annualized standard deviation. If you’re starting with monthly data, you’ll need to annualize both the mean return and the volatility before running the Sharpe calculation.
How to Calculate the Sharpe Ratio Step-by-Step

Let’s walk through a real example. You’re checking out Fund X, which reports an average annual return of 12.0% over five years. The fund’s annual standard deviation is 15.0%, and the current risk-free rate sits at 2.0%.
First, figure out the excess return: 12.0% − 2.0% = 10.0%. Next, divide that by the standard deviation: 10.0% / 15.0% = 0.667. Fund X has a Sharpe ratio of 0.67, so it delivered 0.67 percentage points of excess return for every percentage point of volatility.
Now compare that to Fund Y. Fund Y has an average annual return of 8.0%, standard deviation of 6.0%, and the same 2.0% risk-free rate. Excess return: 8.0% − 2.0% = 6.0%. Sharpe ratio: 6.0% / 6.0% = 1.0. Fund Y earned less in absolute terms, but it’s got a higher Sharpe ratio because it delivered those returns with way less volatility.
Before you start crunching numbers, make sure you’ve got:
Historical return series (monthly or daily prices for at least three years).
A clear time window (trailing five years or since inception, whatever makes sense).
The risk-free rate that matches your return frequency (annualized for annual returns, or scaled right for monthly data).
Standard deviation of returns over the same period, calculated the same way throughout.
Net of fees returns so you’re seeing what an investor actually earns after management fees and expenses.
If you’re working with monthly returns, you’ll need to annualize both the mean return and the standard deviation before plugging them into the formula. Multiply the monthly average return by 12 to annualize it. Multiply the monthly standard deviation by the square root of 12 (around 3.464) to convert it to an annual figure.
Interpreting Sharpe Ratio Values

A Sharpe ratio above 1.0 tells you the fund’s delivering more than one percentage point of excess return for every percentage point of risk. That’s usually considered good. Above 2.0 is very good. Anything above 3.0 is rare and exceptional for diversified funds.
Negative Sharpe ratios mean the fund earned less than the risk-free rate. If you could’ve done better in Treasury bills without any volatility, the fund didn’t justify its risk. A Sharpe ratio near zero means the fund barely paid you for the swings you endured.
Context matters a lot. A bond fund might show a Sharpe ratio of 0.80 and still be competitive, because bond volatility runs lower than equity volatility. An aggressive growth stock fund might need a Sharpe above 1.0 to look attractive, given the higher swings investors accept. Timeframe affects interpretation too. Sharpe ratios over short windows (one year or less) can be noisy and unreliable, while five year or ten year ratios smooth out short term luck or market weirdness.
Asset class and market conditions shape what counts as “good.” During low interest rate periods, risk-free rates drop, which can pump up Sharpe ratios across the board. During volatile markets, standard deviations rise, which can push Sharpe ratios down even if absolute returns hold steady. Always compare funds within the same category and over the same period to make fair calls.
Comparing Funds Using the Sharpe Ratio

The Sharpe ratio really shines when you need to pick between multiple funds. It levels everything out by accounting for both return and risk, so you’re not just chasing the highest raw performance.
Say you’re choosing among four equity funds. All operate in the same category and charge similar fees, but their return and risk profiles are different. Here’s how their trailing five year numbers stack up:
| Fund Name | Annualized Return | Sharpe Ratio |
|---|---|---|
| Growth Fund A | 14.0% | 0.85 |
| Balanced Fund B | 10.0% | 1.10 |
| Aggressive Fund C | 16.0% | 0.70 |
| Conservative Fund D | 8.0% | 1.05 |
Balanced Fund B has the highest Sharpe ratio at 1.10, even though it didn’t post the highest return. That tells you it gave you the most efficient mix of return and risk. Aggressive Fund C posted the highest absolute return (16.0%), but its Sharpe ratio of 0.70 shows it came with way higher volatility, making each percentage point of return harder to earn and tougher to live with.
When you compare funds this way, look for consistency. A fund with a Sharpe of 1.10 over five years is more reliable than a fund that swings between 0.50 and 1.50 depending on the market. Check Sharpe ratios across multiple periods (trailing one year, three years, five years) to confirm the pattern holds. If a fund’s Sharpe collapses during downturns, it might be taking hidden risks that only pop up when markets turn ugly.
Use Sharpe ratios to knock out underperformers and narrow your shortlist. Then layer in other stuff like fees, manager tenure, liquidity, and how the fund fits your broader portfolio. The ratio doesn’t tell you everything, but it tells you enough to dodge funds that deliver so-so returns for high volatility.
Limitations of the Sharpe Ratio

The Sharpe ratio’s got weak spots. It assumes returns follow a normal distribution, but real world fund returns often show skewness (leaning toward big gains or losses) and fat tails (more extreme outliers than a normal curve predicts). When returns aren’t symmetrical, the Sharpe ratio can mislead you.
The ratio treats all volatility the same. It dings upside swings just as much as downside crashes, even though most investors only care about losses. A fund that delivers big positive surprises will see its standard deviation rise, which lowers its Sharpe ratio, even though that volatility feels good.
Outliers can mess up the calculation. One awful month or one spectacular month can shift the standard deviation and skew the Sharpe ratio, especially over short measurement periods. If you calculate Sharpe over just one year, a single bad quarter might make a solid fund look weak.
The Sharpe ratio also ignores correlation with your existing portfolio. A fund might have a mediocre Sharpe on its own but provide valuable diversification because it zigs when your other holdings zag. The ratio measures standalone efficiency, not how the fund improves your total portfolio.
Here’s what to watch for:
Assumes normal distribution of returns, which rarely holds in practice.
Penalizes upside volatility just as much as downside risk.
Sensitive to outliers, especially over short timeframes.
Doesn’t account for portfolio level diversification or correlation benefits.
Sharpe Ratio vs. Sortino and Treynor Ratios

The Sharpe ratio isn’t the only way to measure risk-adjusted return. Two close cousins (the Sortino ratio and the Treynor ratio) offer different angles that matter in specific situations.
Sharpe vs. Sortino
The Sortino ratio tweaks the Sharpe formula by swapping standard deviation for downside deviation. Downside deviation only counts the volatility of negative returns, ignoring the upside swings. The formula becomes:
Sortino Ratio = (Return of Portfolio − Risk-Free Rate) / Downside Deviation
This makes the Sortino ratio better for funds that show asymmetric return patterns, where gains are large and steady but losses are infrequent and sharp. A fund with lots of small positive months and one big drawdown will have a higher Sortino than Sharpe, because Sortino ignores the calm upside volatility. If downside protection’s your priority, Sortino gives you a clearer picture.
Sharpe vs. Treynor
The Treynor ratio swaps out standard deviation for beta, which measures how much the fund moves relative to the overall market. The formula is:
Treynor Ratio = (Return of Portfolio − Risk-Free Rate) / Beta
Beta isolates systematic risk, the risk you can’t diversify away by holding more funds. A fund with a beta of 1.2 moves 20% more than the market. A beta of 0.8 means it’s 20% calmer. Treynor’s most useful when you’re evaluating diversified portfolios where market risk dominates. If a fund has high total volatility (high standard deviation) but low beta, the Sharpe ratio will look worse than the Treynor, because much of that volatility is idiosyncratic and could be diversified away.
When to Choose Each Metric
Use the Sharpe ratio for general fund comparison when you care about total volatility and want a single, easy number. It works well for most retail investors and for screening funds across categories.
Choose the Sortino ratio when downside risk matters more than upside volatility. Common in retirement planning, risk-averse strategies, or funds with asymmetric return profiles like certain alternative investments.
Pick the Treynor ratio when you’re building a diversified portfolio and want to check how much return you’re earning for the market risk you’re taking. It’s especially relevant for equity funds that closely track broad indexes, where beta’s a cleaner measure of risk than total standard deviation.
Final Words
We covered what the Sharpe ratio measures, the formula, and a step-by-step calculation so you can run the numbers yourself.
We also explained how to read Sharpe values, compare funds, and where the metric falls short. Plus quick notes on Sortino and Treynor for different questions.
Keep this as a short checklist when assessing fund risk-adjusted returns (Sharpe ratio): excess return, volatility, time frame, and consistency. Use it as one clear tool, and you’ll make steadier, more confident fund choices over time.
FAQ
Q: What is the Sharpe ratio for risk-adjusted return and how do you measure risk-adjusted returns?
A: The Sharpe ratio measures risk-adjusted return by dividing a portfolio’s excess return (portfolio return minus the risk-free rate) by the standard deviation of returns, showing return earned per unit of volatility.
Q: What is the 70 20 10 rule in investing?
A: The 70/20/10 rule suggests splitting new money: 70% into low-cost core holdings, 20% into higher-growth or active ideas, and 10% into speculative bets to balance safety and opportunity.
Q: What is the 15 * 15 * 15 rule?
A: The 15×15×15 rule often refers to a quick heuristic: save 15% of income, invest for 15 years, and assume a 15% return; it’s a rough benchmark, not a guaranteed plan.