

Think a fund with big daily volume is always cheap to trade? Think again.
Trading volume hides a lot.
Bid-ask spreads are the real toll you pay to get in and out.
What the fund owns and how it can sell matters just as much as the headline volume.
This post shows a few quick checks you can run in 10 to 20 minutes: average daily volume vs assets, quoted and effective spreads, NAV (net asset value) premium or discount, and the ETF creation/redemption plumbing.
Read on to learn how to spot true tradability and avoid surprise costs.
Core Methods for Assessing Fund Liquidity and Bid‑Ask Spreads

Fund liquidity works on two levels: how easily you can trade the fund, and how easily the fund can sell what it owns.
Trading volume shows you how many shares changed hands. It doesn’t tell you if those trades crossed wide spreads, if the underlying bonds or stocks could actually be sold fast during a panic, or if the fund structure even lets you get out when you need to. A fund holding $2 billion in small‑cap stocks trades completely differently from one holding $2 billion in Treasuries, even when both show similar daily dollar volume. What the fund owns matters just as much as its own trading activity.
ETFs and mutual funds handle liquidity in different ways. An ETF trades throughout the day on an exchange with real‑time bid and ask prices. You pay the spread and any market impact, but you get out immediately. A mutual fund prices once per day at NAV. You submit a redemption and settle at that evening’s calculated price. There’s no quoted spread, but you can still face embedded costs if the fund has to sell illiquid stuff to meet your redemption. ETFs also have a creation/redemption setup that lets authorized participants inject or pull liquidity at the portfolio level, which can tighten spreads beyond what secondary trading volume would suggest.
Bid‑ask spreads are the most direct measure of transaction cost. When you see an ask of $100.10 and a bid of $99.90, that $0.20 spread means buying then immediately selling costs you 20 cents per share. It’s a round‑trip toll before the market even moves. Wider spreads during volatility (think 2020, 2022) mean higher trading costs and can trap you in positions you’d rather exit.
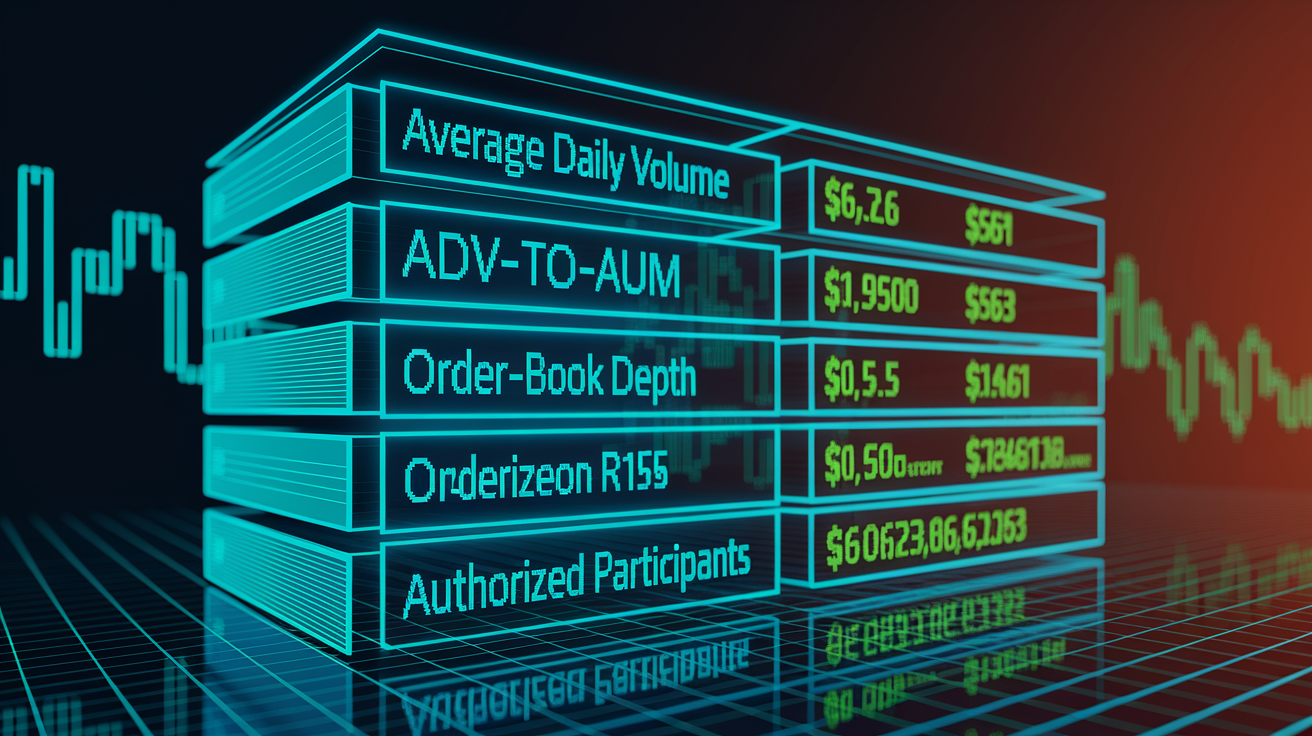
Metrics to check right away:
- Average daily volume (ADV) and the ADV‑to‑AUM ratio, which shows how long full liquidation would take at the current pace.
- Bid‑ask spread in basis points, calculated as (ask − bid) / midpoint × 10,000, so you can compare across funds consistently.
- NAV deviations (premium or discount), which reveal whether the ETF price tracks the underlying portfolio value or trades rich or cheap.
- Creation/redemption structure, including creation‑unit size, authorized‑participant count, and what’s actually in the underlying basket.
Key Liquidity Indicators for Evaluating Fund Tradability
Average daily volume tells you how many dollars or shares trade hands each day. It’s a first‑order sense of market depth. Pair ADV with the fund’s assets under management to get the ADV/AUM ratio. If a $1 billion ETF trades $10 million per day, ADV/AUM is 1%, meaning a full unwind at current volume would take roughly 100 trading days. A practical rule of thumb is to keep any single trade below 1 to 5% of ADV to limit market impact. Larger trades risk moving the price against you, especially in fixed‑income or small‑cap funds where underlying liquidity is thin.
Turnover ratio and order‑book depth add useful detail. Turnover tells you how often the fund reshuffles its holdings. Higher turnover combined with low underlying liquidity can widen spreads as the portfolio manager competes with other traders. Order‑book depth (shares or notional value available at the best bid and ask) shows how much you can trade at the quoted spread before stepping through worse price levels. Authorized‑participant presence matters for ETFs too. More APs mean more liquidity plumbing and tighter spreads. A single dominant AP can introduce execution risk during stress.
How to read it:
- ADV/AUM above 2% suggests strong tradability. Below 0.25% flags potential scale problems.
- Turnover paired with underlying‑asset spreads estimates annual trading drag. For example, 50% turnover × 20 bps round‑trip = 10 bps annual cost.
- Top‑of‑book depth as a multiple of typical trade size. If quoted depth is only 500 shares but you need 5,000, expect market impact beyond the quoted spread.
Interpreting Bid‑Ask Spreads in Fund Evaluation

Quoted spread is the difference between the current ask (sell price) and bid (buy price). If the ask is $100.10 and the bid is $100.05, the quoted spread is $0.05. Convert that to relative terms by dividing by the midpoint and multiplying by 10,000 to get basis points: (0.05 / 100.075) × 10,000 comes out to about 5.0 bps. This relative spread is the number you compare across funds, asset classes, and time periods.
Effective spread measures actual execution quality. After you trade, take the difference between your fill price and the midpoint at the moment of the trade, double it, and express it in basis points. If you bought at $100.12 and the mid was $100.075, the one‑way slippage is $0.045, so the effective spread is 2 × 0.045 / 100.075 × 10,000, roughly 9.0 bps. When effective spread is much wider than quoted spread, it signals market impact, stale quotes, or poor execution tactics. Realized spread is used by market makers and captures profit or loss after inventory mean‑reversion. For investors, effective spread is the more relevant cost measure.
Typical ETF spread benchmarks guide your expectations. Large‑cap equity ETFs in liquid markets often quote 1 to 5 bps. Mid‑cap ETFs widen to 5 to 20 bps. Small‑cap can reach 20 to 100 bps. Fixed‑income ETFs, especially high‑yield or municipal, commonly sit at 10 to 50 bps depending on underlying bond market conditions. Use these ranges to spot outliers and to set alert thresholds. If a historically tight fund suddenly quotes 50 bps, investigate whether the underlying market seized up or whether the authorized participants stepped back.
| Spread Type | Definition | Use Case | Example Value |
|---|---|---|---|
| Quoted Spread | Ask − Bid in price units | Pre‑trade cost estimate | $0.05 (5 bps on $100 mid) |
| Relative Spread | (Ask − Bid) / Mid × 10,000 | Cross‑fund, cross‑asset comparison | 5.0 bps |
| Effective Spread | 2 × |Execution − Mid| | Post‑trade quality check | 9.0 bps (signals 4 bps impact) |
| Realized Spread | Market‑maker inventory P&L metric | Market‑maker profitability | Variable; less relevant to buy‑side |
Measuring Market Impact and Slippage in Fund Liquidity Analysis

Market impact is the price movement your order causes. A simple linear model approximates one‑way impact as λ × (trade size / ADV), where λ is a calibration constant derived from historical trades. If λ = 100 bps and you trade 2% of ADV, estimated one‑way impact is 100 × 0.02 = 2 bps. Round‑trip impact doubles to roughly 4 bps. Actual impact is nonlinear and increases with urgency, underlying illiquidity, and order‑book thinness, so treat λ as a starting point and update it with post‑trade data.
Implementation shortfall quantifies the cost of delay and execution versus your decision point. The formula is (execution price − decision price) × number of shares. If you decided to buy at $50.00, averaged $50.15 across fills, and bought 10,000 shares, your implementation shortfall is $0.15 × 10,000 = $1,500. Express that as basis points of the position: $1,500 / ($50.00 × 10,000) × 10,000 = 30 bps. High implementation shortfall points to either poor execution tactics or a fast‑moving market that penalized hesitation. The Amihud illiquidity measure (daily absolute return divided by dollar volume) offers a relative ranking tool. Higher Amihud values flag securities or funds where price swings are large relative to trading activity, a classic sign of thin liquidity.
Three quick examples:
- Small trade in liquid ETF: Trade $500,000 (1% of $50M ADV), λ = 50 bps. Estimated impact = 50 × 0.01 = 0.5 bps one‑way, about 1 bps round‑trip.
- Large trade in illiquid ETF: Trade $1M (200% of $500k ADV), λ = 100 bps. Linear estimate = 100 × 2.0 = 200 bps, but nonlinear reality is probably much worse. Consider slicing or using the primary market.
- Implementation shortfall: Decision price $25, average fill $25.10, 20,000 shares. IS = $0.10 × 20,000 = $2,000. As bps = $2,000 / $500,000 × 10,000 = 40 bps.
Liquidity Mechanics Across Fund Structures
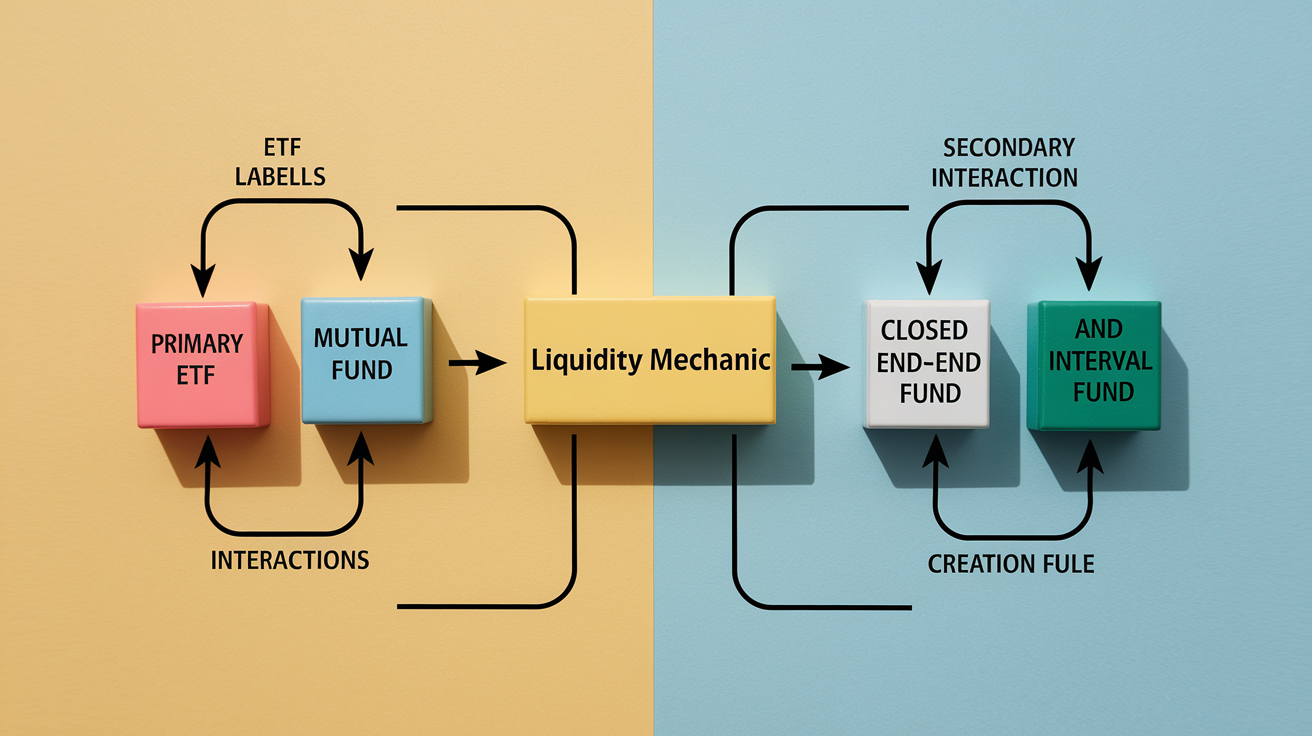
ETFs get liquidity through a dual setup: secondary‑market trading on an exchange and primary‑market creation/redemption with authorized participants. When you buy or sell an ETF share during the day, you’re trading with another investor or a market maker at the quoted bid or ask. Behind the scenes, APs can assemble or disassemble creation units (large blocks of ETF shares exchanged for the underlying basket of securities), which keeps the ETF price close to NAV and injects liquidity even when secondary trading is light. This structure means an ETF can be more liquid than its average trading volume suggests, especially for institutional‑size blocks executed via the primary market. The number of APs matters. Multiple competing APs tighten spreads and reduce execution risk. A single AP introduces concentration risk during stress. You can read more about how these dynamics shift in volatile markets.
Mutual funds price once daily at net asset value, calculated after markets close (typically 4:00 PM ET in the United States). You submit a redemption order during the day, receive that evening’s NAV as your exit price, and settle T+1 or T+2. There’s no quoted spread because there’s no intraday market, but transaction costs still exist. They’re embedded as market impact when the fund sells holdings to meet redemptions, potential redemption fees (common in some bond and international funds), and dilution for remaining shareholders if the fund must sell at unfavorable prices. During stress, mutual funds can impose redemption gates or suspend redemptions altogether. That risk became pretty visible in some credit and real‑estate funds during 2020.
Closed‑end funds trade on exchanges like ETFs but without creation/redemption mechanics. Supply is fixed, so the share price floats independently of NAV, often trading at persistent premiums or discounts. A 10% discount might look attractive, but it can widen to 15% if sentiment sours, locking in a loss unrelated to the portfolio’s performance. Interval funds offer periodic redemption windows (quarterly or semi‑annually) but limit the percentage of shares that can be redeemed, adding another layer of liquidity constraint.
Redemption mechanics by structure:
- ETFs: Intraday secondary trading at bid/ask spread. Large trades via creation/redemption at NAV with AP intermediation. No redemption gates.
- Mutual funds: End‑of‑day NAV redemption. Settlement T+1 or T+2. Possible redemption fees, gates, or suspensions during stress.
- Closed‑end and interval funds: No redemption (CEF) or limited periodic redemption (interval). Price determined by supply/demand, not NAV.
Stress Testing and Scenario Analysis for Fund Liquidity
Liquidity behaves differently under stress, so historical calm‑market metrics can mislead. Stress‑testing uses extreme historical windows (2008 financial crisis, 2011 European sovereign debt turmoil, March 2020 COVID shock, and 2022 rate‑hike volatility) to model how spreads widen, depth collapses, and ADV shifts when markets seize. Pull daily spread and volume data for those periods, compute the 95th or 99th percentile spread and the 5th percentile ADV, and use those as your stressed assumptions. If a fund’s normal spread is 10 bps but hit 80 bps during March 2020, plan for 80 bps in your next stress scenario.
Liquidity‑adjusted value‑at‑risk incorporates expected liquidation cost into risk capital. Standard VaR assumes you can exit at current prices, but in reality exiting a large position incurs spread cost and market impact. Add the expected liquidation cost (spread plus impact) to the VaR loss, or extend the VaR horizon to match the estimated liquidation time. If normal VaR at 5% confidence is $1 million on a $100 million position and you estimate 25 bps liquidation cost, add $250,000 to the risk capital or model a longer holding period where volatility compounds.
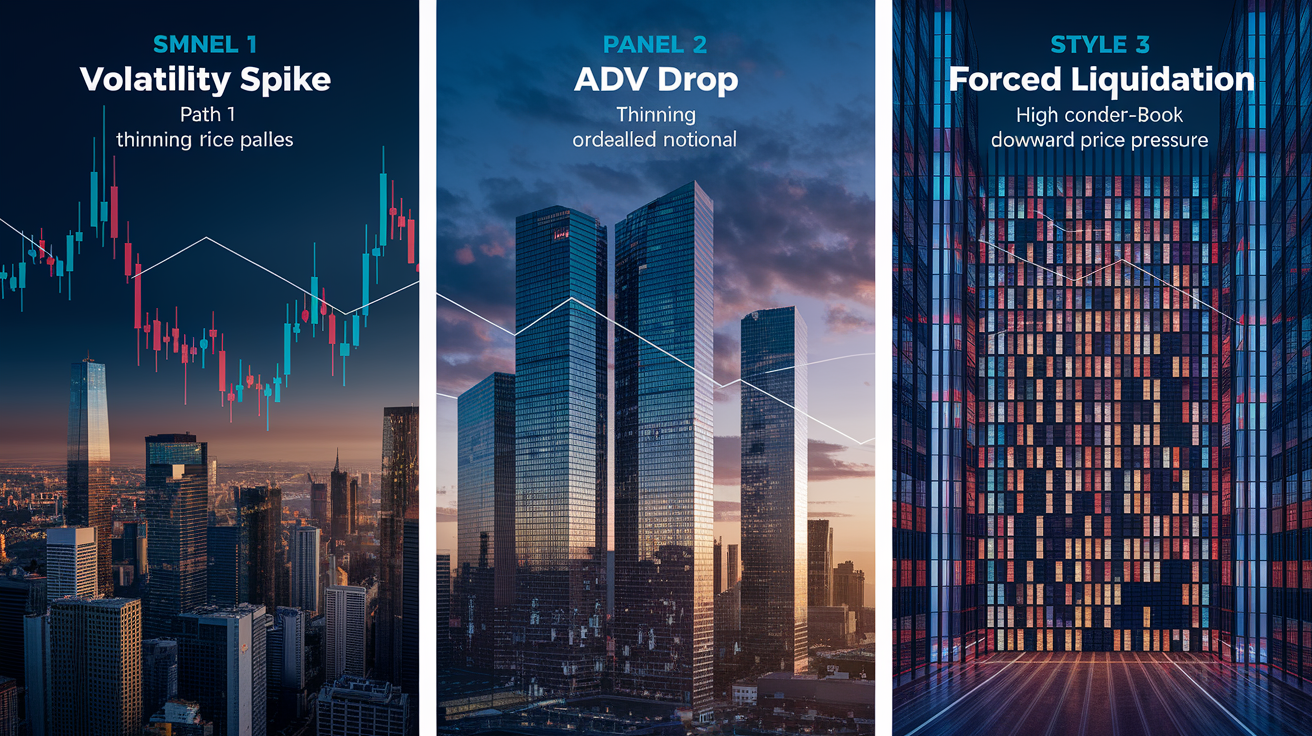
Three scenario steps for a stress test:
- Market volatility spike: Assume VIX jumps from 15 to 40. Re‑run spread widening (for example, multiply current spread by historical VIX ratio) and depth reduction (halve quoted size).
- ADV drop: Model ADV falling by 30 to 50% as market participants retreat. Recalculate trade‑size limits (1 to 5% of stressed ADV) and expected days to liquidate.
- Spread widening and forced liquidation: Simulate selling 20% of the portfolio over five days at stressed spreads and reduced ADV. Compute total slippage in basis points and compare against your risk budget.
Data Sources and Tools for Liquidity and Spread Evaluation

Order‑book snapshots and time‑and‑sales (TAQ) data provide the raw inputs for spread and depth analysis. TAQ records every trade (timestamp, price, size) and every quote update, letting you compute quoted spreads at any moment, measure effective spreads by comparing execution prices to prevailing mids, and analyze intraday patterns. Spreads typically widen at the open and close. For fixed‑income funds, TRACE (Trade Reporting and Compliance Engine) captures bond trades with similar granularity. Since many bonds trade over‑the‑counter, TRACE is the primary source for bond‑level liquidity metrics that roll up into fund‑level analysis.
Historical spread time‑series let you track trends and set alert thresholds. Download daily or intraday spread data, compute rolling averages (30‑day, 90‑day), and flag when current spreads exceed the average by more than 50%. That’s a common trigger for deeper review. Pair spread data with volume, volatility (VIX), and market‑stress indicators to understand drivers. VWAP (volume‑weighted average price) and TWAP (time‑weighted average price) simulations model execution cost under different slicing strategies. Compare simulated fills against actual order‑book depth to forecast market impact before trading.
Key datasets:
- TAQ (Trade and Quote): Equity and ETF tick‑by‑tick trades and quotes. Calculate quoted and effective spreads, depth, and intraday patterns.
- TRACE: Bond transaction data, essential for assessing underlying liquidity in fixed‑income ETFs and mutual funds.
- Exchange depth feeds: Real‑time or historical order‑book snapshots showing size available at each price level. Used to size trades and estimate slippage beyond top‑of‑book.
Total Cost of Ownership (TCO) and Portfolio Impact of Liquidity

Total cost of ownership combines every fee and friction: the fund’s annual management fee (explicit), commissions and platform fees (explicit), bid‑ask spread (implicit), market impact (implicit), and implementation shortfall or timing cost (implicit). A typical TCO build‑up for an ETF might look like this: management fee 10 bps per year, annualized trading drag from portfolio turnover 25 bps (assume 50% turnover and 50 bps round‑trip cost per trade, so 0.50 × 50 = 25 bps), and average spread cost on entry/exit 5 bps for a one‑year hold, totaling roughly 40 bps.
Liquidity costs scale with rebalancing frequency and position changes. A portfolio that rebalances quarterly and trades 10% of assets each time incurs four rounds of spread and impact costs annually. If each rebalance costs 10 bps, annual liquidity drag is 40 bps. Transaction‑cost analysis (TCA) platforms measure this after the fact by comparing execution prices to benchmarks (arrival price, VWAP, close) and attributing performance drag to trading decisions. Use TCA results to refine your λ parameter for market impact, adjust order tactics (limit versus market, slicing), and choose lower‑cost funds when liquidity profiles are similar.
Liquidity‑adjusted performance attribution separates alpha from trading friction. If a fund reports 8% gross return but incurred 50 bps in liquidity and trading costs, net investor return is closer to 7.5%. For active strategies with high turnover in illiquid names, liquidity costs can erase half the apparent alpha. Recognizing this in advance shifts portfolio construction toward funds with tighter spreads or lower turnover.
| Cost Component | Description | Example bps Impact |
|---|---|---|
| Management Fee | Annual expense ratio charged by the fund | 10 bps |
| Trading Drag | Portfolio turnover × round‑trip spread/impact | 25 bps (50% turnover × 50 bps) |
| Entry/Exit Spread | Bid‑ask spread on investor’s own trade | 5 bps (one‑time or annualized) |
Practical Liquidity Due‑Diligence Checklist for Fund Selection
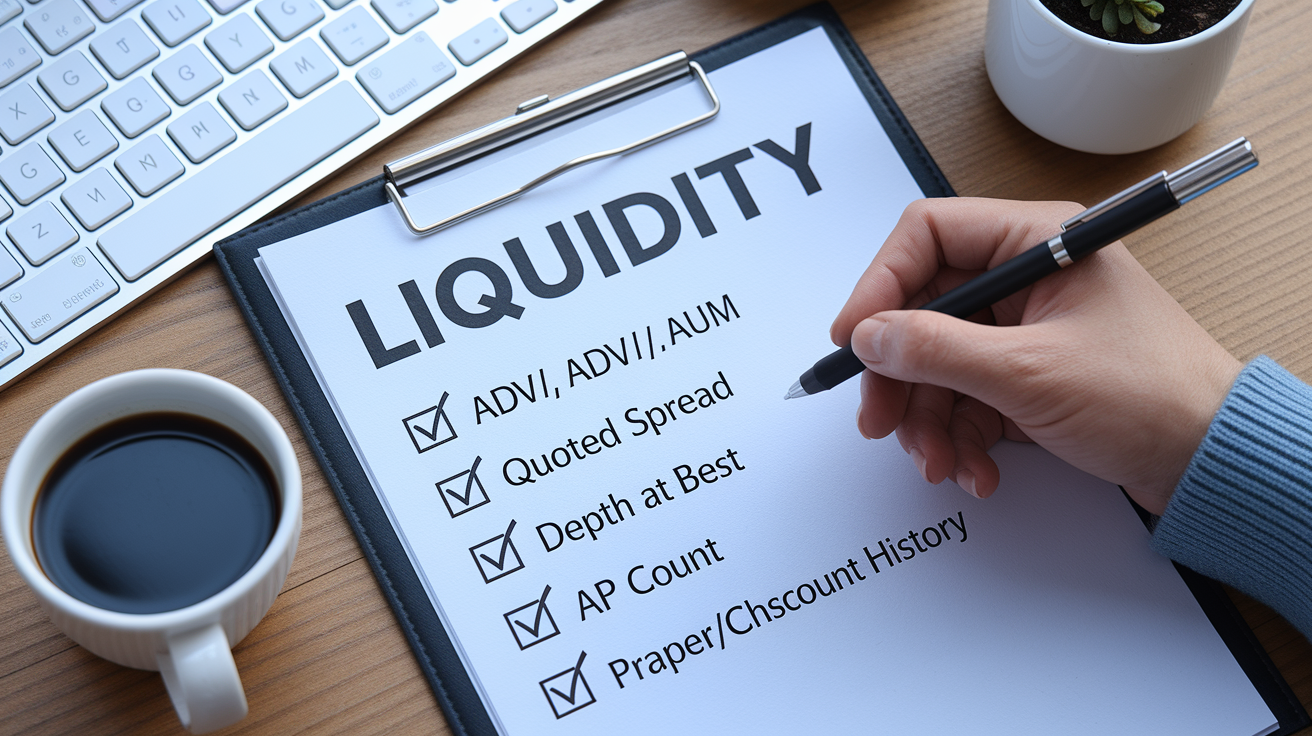
Start by collecting six core data points for any fund under consideration: average daily volume (shares and dollars), percentage of AUM traded per day, current quoted spread in basis points, top‑of‑book depth (shares or notional at best bid/ask), number of authorized participants (for ETFs), and recent premium/discount history. Compare these metrics against the benchmarks outlined earlier (large‑cap equity spreads around 1 to 5 bps, mid‑cap 5 to 20 bps, small‑cap and fixed income wider) and flag any fund quoting spreads more than 50% above its 90‑day average.
Set numeric trading limits tied to ADV. A standard rule is to keep each execution below 1 to 5% of ADV. Stricter funds or compliance teams use 1%, while more flexible portfolios allow up to 5% when urgency justifies higher impact. Calculate expected round‑trip cost by adding quoted spread and estimated market impact (using your calibrated λ and trade size as % of ADV), then compare that total against your cost budget. If the expected cost exceeds tolerance, either slice the order over multiple days or access the primary market through an AP for large blocks.
Monitor liquidity on a recurring schedule. Weekly updates for active positions, monthly for passive core holdings. Trigger an in‑depth review if spreads widen by more than 50% versus the trailing 90‑day average, if ADV drops below your minimum threshold (for example, ADV/AUM falls under 0.25%), or if the number of active APs declines. For more on multi‑metric assessment frameworks, see this Morningstar guide on fund liquidity, and review key factors that drive ETF bid‑ask spreads to understand what might change your alerts.
Six due‑diligence steps:
- Collect ADV, ADV/AUM ratio, quoted spread (bps), depth at best bid/ask, AP count, and premium/discount history.
- Compare current spread to 90‑day average. Flag if more than 50% wider and investigate underlying or market‑maker changes.
- Calculate expected trade cost: quoted spread plus market impact (λ × trade%/ADV). Confirm it fits within cost budget.
- Size trade to 1 to 5% of ADV per day. For larger orders consider slicing or primary‑market execution via AP.
- Check redemption terms (mutual funds) or creation‑unit mechanics (ETFs). Confirm no gates, high fees, or structural constraints.
- Schedule periodic reviews (weekly for active, monthly for passive). Update thresholds and λ parameters with post‑trade TCA results.
Final Words
in the action, we walked through how liquidity works, what metrics to watch, and how spreads and market impact add to trading costs. We compared ETFs, mutual funds, and closed end mechanics, and showed practical checks and stress tests.
The key rule: look at more than volume. Check ADV, spread in bps, NAV deviations, and creation/redemption details. Use the short checklist to make calm, process driven choices instead of reacting to headlines.
Keep practicing. Evaluating fund liquidity and bid-ask spreads will help you trade smarter and stay steady.
FAQ
Q: How do I assess fund liquidity and bid-ask spreads?
A: Assessing fund liquidity and bid-ask spreads means looking beyond volume to ADV, spread in bps, NAV deviations, and creation/redemption mechanics to judge true trading cost and tradability.
Q: What are the most important liquidity metrics to check?
A: The most important liquidity metrics to check are average daily volume (ADV), spread in basis points, NAV deviations, creation/redemption structure, top‑of‑book depth, turnover, and AP presence.
Q: How do ETF and mutual fund liquidity differ?
A: ETF and mutual fund liquidity differ because ETFs trade intraday and use authorized participants plus primary markets, while mutual funds use end‑of‑day NAV redemptions and can impose gates or fees.
Q: Why do bid-ask spreads matter for investors?
A: Bid-ask spreads matter because the spread is an immediate trading cost; wider spreads raise execution costs and often widen in volatile markets, increasing the drag on returns.
Q: How do I calculate quoted and effective spreads?
A: Quoted spread equals ask minus bid; relative spread in bps = (ask − bid)/mid × 10,000; effective spread = 2 × |execution − mid|, which shows actual execution quality.
Q: How can I estimate market impact and slippage?
A: Estimating market impact and slippage uses trade size versus ADV (trade%×lambda), implementation shortfall to compare execution versus decision price, and Amihud for return‑per‑volume illiquidity.
Q: How do I stress-test a fund’s liquidity?
A: Stress‑testing a fund’s liquidity means running historical stress windows (2008, 2020), modeling ADV drops and spread widening, then estimating liquidation costs and liquidity‑adjusted VaR.
Q: What data sources and tools should I use for liquidity analysis?
A: The main data sources and tools are TAQ for equities, TRACE for bonds, order‑book snapshots, time‑and‑sales, and VWAP/TWAP simulation tools to model execution and spreads.
Q: How does liquidity affect total cost of ownership (TCO)?
A: Liquidity affects TCO because total cost equals explicit fees plus spread plus market impact and timing cost; for example, 10 bps fee + 25 bps trading drag + 5 bps spread ≈ 40 bps.
Q: What practical due‑diligence steps should I follow when selecting a fund?
A: Practical due‑diligence steps include keeping trades ≤1–5% ADV, comparing spreads to their 90‑day average, checking APs/redemption rules, reviewing turnover, testing depth snapshots, and setting alert thresholds.