


What if the one number that shows your worst investing moment could stop you from panicking later?
Maximum drawdown (the biggest percent drop from a portfolio’s peak to its lowest point) tells you how far you actually fell.
Think of it as checking the deepest ditch on a road: it warns how rough the trip might be and how long recovery takes.
This post shows how to read that number, use it to pick strategies you can live with, and set simple rules, like drawdown caps, position sizing, and stop limits, to keep your plan steady.
Understanding the Core Meaning of Maximum Drawdown and Its Practical Use

Maximum drawdown is the biggest percentage drop from a portfolio’s peak to its lowest point before it climbs back up. It’s the worst loss you would’ve taken if you bought at the top and held through the bottom. Think of it as answering, “What was my absolute worst moment in dollar terms?”
The math is straightforward: Maximum Drawdown (MDD) = (Peak Value − Trough Value) ÷ Peak Value. Here’s a real example. Your portfolio grows from $10,000 to $15,000, then drops to $11,000. Peak is $15,000, trough is $11,000. So MDD = (15,000 − 11,000) ÷ 15,000 = 4,000 ÷ 15,000 = 0.2667, or 26.7%. That 26.7% tells you exactly how far your account fell from its best point.
Why do investors care? Because max drawdown shows you what loss actually feels like, not just how much returns wiggle around on average. Volatility tells you about bouncing, but max drawdown tells you how deep the hole got when things went south. This helps you match strategies to what you can stomach. If a 30% drop would make you panic and bail, you can’t use strategies with historical MDD near or above 30%. It’s also useful for comparing managers and funds by seeing their worst historical moments.
Reasons investors watch max drawdown:
- Risk tolerance fit – Makes sure the strategy’s worst historical drop matches what you can handle without freaking out.
- Strategy comparison – Two funds might have similar returns, but the one with lower MDD gave you a smoother ride.
- Position sizing discipline – Knowing expected MDD helps you size bets and set stop losses to avoid blowing up.
- Recovery planning – Understanding past declines helps you estimate how long and how much gain you’ll need to get back to even.
Maximum Drawdown Calculation Methods and Real-World Examples

The rolling peak method is standard for calculating maximum drawdown. At each date, you record the highest value reached so far (the running peak), then figure out the current drawdown as (current equity ÷ peak) − 1. Maximum drawdown is the most negative number in that entire drawdown series. Drawdown duration counts the days (or periods) from peak to trough. Recovery time is the days from trough back to a new peak. Together these three numbers (magnitude, duration, recovery) paint a full picture of how bad the decline was and how long it took to get whole again.
Here’s a real timeline. On January 1, 2020, a portfolio sat at $100,000. By March 23, 2020, it had fallen to $70,000. That’s a 30% maximum drawdown. Drawdown duration (peak to trough) was 82 days. The portfolio didn’t hit a new peak until August 1, 2021, roughly 550 days after the trough. So if you bought at the January peak, you waited nearly 18 months to break even.
Another quick example: Peak $120,000, trough $90,000. MDD = (90,000 − 120,000) ÷ 120,000 = −30,000 ÷ 120,000 = −0.25, or 25%. The table below shows a simplified multi-day sequence.
| Date | Equity Value | Drawdown % |
|---|---|---|
| 2020-01-01 | $100,000 | 0.0% |
| 2020-02-15 | $105,000 | 0.0% |
| 2020-03-23 | $70,000 | −30.0% |
| 2020-06-30 | $85,000 | −19.0% |
| 2021-08-01 | $106,000 | 0.0% |
Interpreting Maximum Drawdown Levels and What Counts as Good or Bad
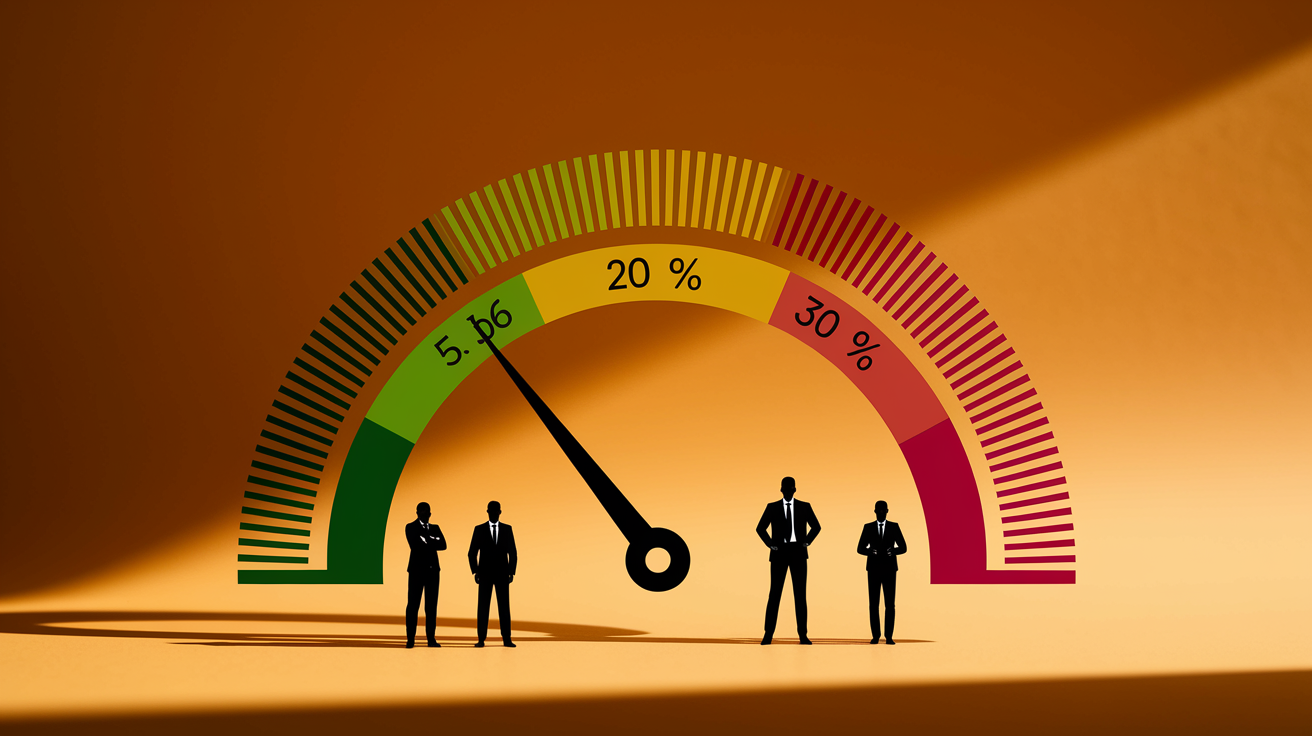
Conservative portfolios usually aim for a maximum drawdown of 5% to 10%. Moderate growth portfolios often accept 10% to 20%. Aggressive strategies (especially equity-heavy or leveraged ones) historically see 20% to 40%, and anything above 30% signals high risk for most people. These aren’t hard rules, but they give you a starting point. If you’re saving for retirement in five years, a strategy with a 40% historical MDD is probably too wild. If you’re 30 years from retirement with steady income, you might tolerate deeper drawdowns for better long-term returns.
The recovery math shows why deeper drawdowns hurt so much. The required gain after a drawdown is: required gain = drawdown ÷ (1 − drawdown). A 10% loss needs an 11.11% gain to break even (0.10 ÷ 0.90 ≈ 0.1111). A 30% loss needs 42.86% (0.30 ÷ 0.70 ≈ 0.4286). A 50% loss demands a 100% gain (0.50 ÷ 0.50 = 1.00). That asymmetry means big drawdowns take way longer and way bigger gains to recover.
For retirement planning, the sequence of returns matters just as much as the average return. If you retire into a 30% drawdown and start pulling money out, you lock in losses and shrink the capital available for recovery. Two retirees with identical portfolio returns can end up with very different outcomes if one hits a deep drawdown early and the other late. Watching MDD helps you tweak withdrawal rates, shift to safer assets, or delay retirement if you’re walking into a high-drawdown period.
Using Maximum Drawdown for Portfolio Risk Assessment and Strategy Selection
Investors use maximum drawdown alongside returns to figure out whether a strategy’s upside justifies its downside. The Calmar ratio makes this explicit: Calmar = annualized return ÷ max drawdown. For example, a fund with a 9% annual return and a 25% max drawdown has a Calmar of 9% ÷ 25% = 0.36. Higher Calmar values mean better return per unit of worst-case loss. When comparing two funds, the one with the higher Calmar gave you more reward for the pain it caused. This helps you dodge funds that look good on return alone but carry hidden tail risk.
Maximum drawdown also affects compounding and CAGR (compound annual growth rate). Deeper losses need disproportionately larger recoveries, which drags down your compound return over time. A portfolio that avoids a 40% drawdown and instead experiences two 15% drawdowns will usually compound faster, even if both paths have similar arithmetic average returns.
Asset allocation decisions (how much you hold in stocks, bonds, cash, and alternatives) directly influence MDD. Diversification across uncorrelated assets tends to reduce maximum drawdown because different assets rarely hit their worst points at the same time. Rebalancing forces you to sell winners and buy losers, which can limit drawdown depth by preventing any single position from taking over.
Ways investors use MDD when evaluating strategy strength:
- Backtest review – Check historical MDD over 1-year, 3-year, and 5-year windows to see consistency.
- Peer comparison – Rank funds or managers by Calmar ratio or return-to-drawdown ratio.
- Scenario stress tests – Model MDD under recession, inflation spike, or crisis scenarios.
- Capital allocation – Put more into strategies with lower MDD for near-term goals. Accept higher MDD for long-term growth.
- Risk budget enforcement – Set a maximum allowable MDD (say, 15%) and reject strategies that exceed it, no matter the return promise.
Maximum Drawdown vs Other Risk Metrics Investors Commonly Use
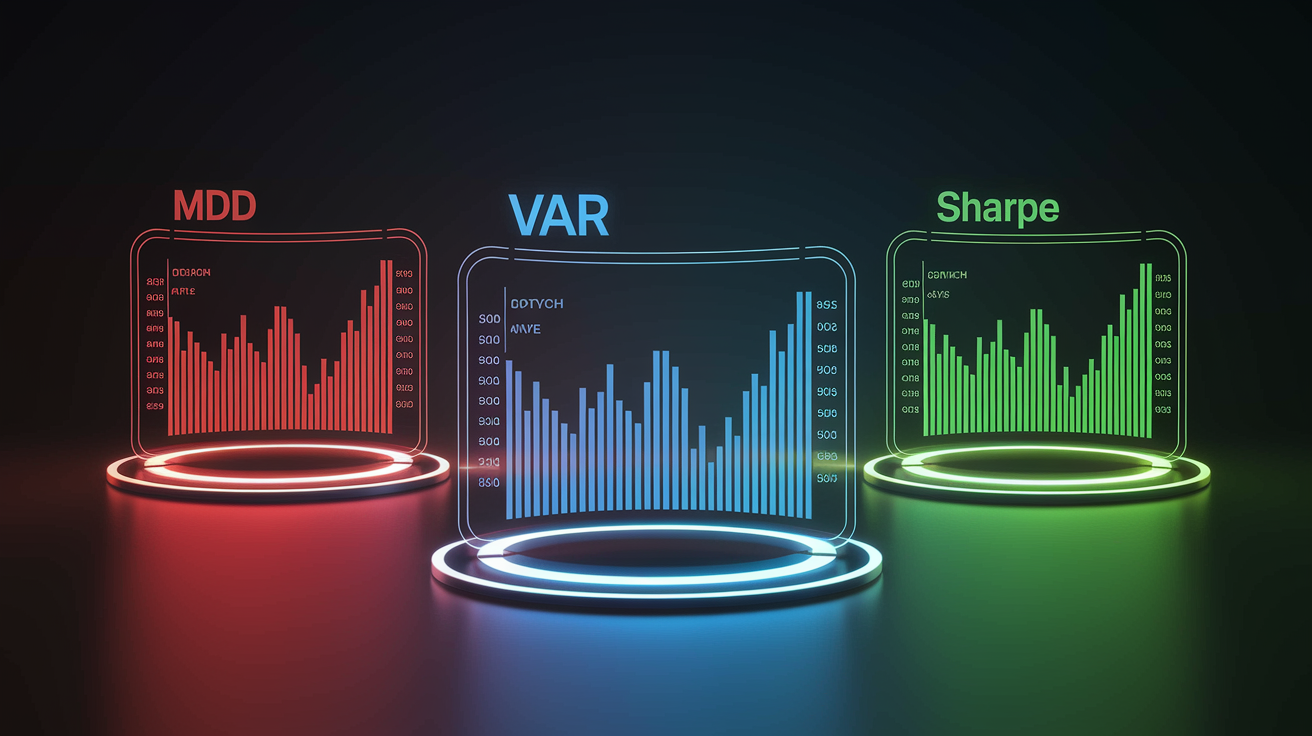
Volatility (standard deviation) measures how much returns bounce around the average, both up and down. Maximum drawdown measures the single worst peak-to-trough decline you actually experienced. A strategy can have low volatility but still suffer a deep drawdown if losses pile up together. High volatility doesn’t guarantee a large drawdown if gains and losses alternate evenly. MDD captures the lived experience of loss in a way volatility can’t.
Value at Risk (VaR) estimates the maximum loss you might expect over a given period at a certain confidence level (say, 95% VaR = worst 5% of outcomes). It’s forward-looking and probabilistic. Maximum drawdown is backward-looking and absolute. It tells you what already happened. VaR can underestimate tail risk if your model assumptions are wrong. MDD shows you the tail event that already occurred.
Sharpe ratio measures return per unit of total volatility. Sortino ratio focuses on downside volatility. Both can look good even when a strategy has deep but rare drawdowns, because they average over time. MDD highlights those deep drawdowns directly, making it a useful partner to Sharpe and Sortino.
| Metric | What It Measures | Strength | Weakness |
|---|---|---|---|
| Volatility (Std Dev) | Dispersion of returns around the mean | Easy to compute; widely used | Treats upside and downside equally; doesn’t show worst-case path |
| Value at Risk (VaR) | Probabilistic loss threshold at confidence level | Forward-looking; quantifies tail probability | Model-dependent; can miss extreme events |
| Sharpe Ratio | Excess return per unit of volatility | Risk-adjusted performance in one number | Can mask deep drawdowns with high average returns |
| Maximum Drawdown | Worst peak-to-trough decline in history | Shows actual lived worst-case loss; intuitive | Backward-looking; doesn’t predict future drawdowns |
How to Apply Maximum Drawdown in Real Investing: Rules, Limits, and Practical Tools

Traders often set daily “kill switches” to limit cascading losses. A common rule is to stop trading for the day if your account loses 1% to 2% of equity. On a $100,000 account, a 1% daily limit means you stop at $1,000 loss. This prevents emotional revenge trading and caps damage on bad days.
Portfolio-level MDD caps work the same way over longer timeframes. Conservative investors might set a 10% cap, moderate investors 20%. When you hit that threshold, you pause new trades, review your positions, or hedge to prevent deeper losses.
Position sizing is how you convert a portfolio MDD cap into per-trade risk. If you allow a 20% maximum drawdown and risk 1% per trade, you can theoretically survive roughly 22 consecutive losing trades before hitting your limit (solve: number of trades = ln(1 − 0.20) ÷ ln(1 − 0.01) ≈ 22). In practice, wins interrupt losing streaks, but the math shows that smaller per-trade risk extends your runway. Most disciplined traders risk 0.5% to 2% per trade. The smaller the per-trade risk, the lower your realized MDD tends to be.
Diversification reduces drawdown severity when assets or strategies aren’t correlated. If you hold stocks, bonds, commodities, and real estate, a stock crash might coincide with bond gains or stable commodity prices, cushioning the total portfolio drawdown.
Leverage magnifies both returns and drawdowns. A 2× leveraged portfolio will roughly double both gains and losses, so a 15% unleveraged drawdown becomes 30% with 2× leverage. If you use leverage, you must accept proportionally larger MDD or reduce position sizes to offset the multiplier. For a detailed guide on managing drawdown risk, see What Is Maximum Drawdown? Formula and How to Manage.
Steps to set up a personal drawdown control plan:
- Choose your MDD cap – Pick a number you can psychologically handle (10% conservative, 20% moderate, 30% aggressive).
- Set per-trade risk – Limit each trade to 0.5% to 2% of total capital to extend your losing-streak buffer.
- Define daily stop rules – Stop trading if you lose 1% to 2% in a single day to prevent emotional decisions.
- Diversify positions – Hold uncorrelated assets or strategies to reduce simultaneous drawdowns.
- Monitor peak and trough daily – Track your running peak and current drawdown in a simple spreadsheet or platform tool.
- Trigger review at 50% of cap – If your cap is 20% and you hit 10%, pause, review positions, consider hedging or reducing size, and document what happened.
Stress Testing Maximum Drawdown: Historical, Scenario, and Monte Carlo Approaches
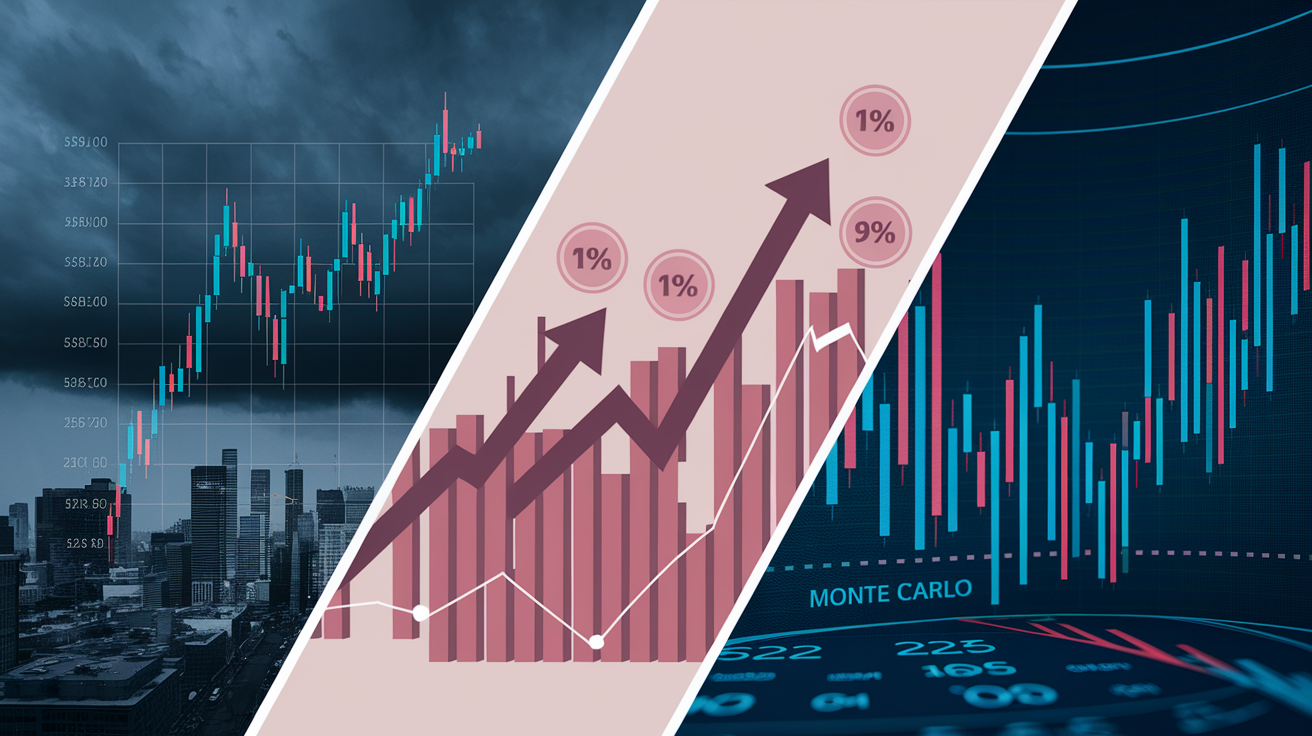
Stress testing helps you estimate future MDD by replaying bad periods or simulating thousands of possible paths. Historical stress tests replay specific crisis periods (2008 financial crisis, 2020 COVID crash, 2022 bond/stock selloff) using your current portfolio weights. You see how deep the drawdown would’ve been if you held today’s positions during those events.
Regime-specific scenario modeling tweaks variables like interest rates, inflation, or volatility to create “what if” stress cases. These forward-looking scenarios help you understand risks that haven’t happened yet but could.
Monte Carlo simulation generates thousands of randomized return sequences based on your strategy’s historical mean, volatility, and correlation structure. Each simulated path produces a drawdown figure. The distribution of those drawdowns shows you the range of possible outcomes: median MDD, 95th percentile MDD, worst-case MDD, and how often you might exceed your personal cap. You also get distributions of drawdown duration and recovery time, which tell you how long bad periods might last. Mean time to recovery is the average number of periods it takes to climb back to a new peak after a drawdown. Useful for setting realistic expectations.
Monte Carlo Drawdown Simulation
Monte Carlo drawdown simulation works by randomizing daily or monthly returns based on your strategy’s stats (average return, standard deviation, and sometimes skew or kurtosis). The computer runs 5,000 or 10,000 simulated paths, each covering your chosen time horizon (say, 10 years). For each path, the algorithm tracks the rolling peak and calculates the maximum drawdown.
After all paths finish, you get a histogram showing how often MDD fell into different buckets: 0% to 10%, 10% to 20%, 20% to 30%, and so on. The 50th percentile (median) tells you the typical worst-case. The 95th percentile shows the tail risk (only 5% of paths were worse). This helps you stress-test your plan. If 95% of simulations keep MDD below 25% and you can tolerate 30%, you’re probably safe. If the 95th percentile MDD is 40% and you can’t handle that, you need to adjust position sizes, add diversification, or choose a less volatile strategy.
Behavioral Impacts of Maximum Drawdown and How to Stay Committed During Declines

Investors react more strongly to maximum drawdown than to volatility because MDD represents a real, cumulative loss they can see in their account balance. A 30% drawdown feels visceral. Your $100,000 is now $70,000. Meanwhile, a volatility number like “15% standard deviation” is abstract. Two strategies with identical 15% annual returns can have very different investor experiences if one has a 12% MDD and the other a 45% MDD. The high-MDD strategy gets abandoned more often, even when it’s profitable over time, because the psychological strain of watching a 45% decline is overwhelming.
Preparing emotionally for expected drawdown is your best defense against panic selling. If your backtest shows a 25% historical MDD, write down “I expect a 25% drop at some point” before you invest. When the drop comes, you’ve already mentally rehearsed it. You know it’s normal, not a signal to bail. Setting rules in advance (like “I won’t sell unless drawdown exceeds 30%”) removes emotion from the decision. Journaling your plan and reviewing it during calm periods reinforces discipline when markets get loud.
Communicating drawdown expectations to clients or family members is just as important. If you manage money for others, show them the historical MDD and recovery timeline during onboarding. Say, “This strategy has dropped 20% in the past and took 18 months to recover. Are you comfortable with that?” If they say yes, document it. When the drawdown happens, remind them of the conversation.
For family money, involve your spouse or dependents in the plan. Explain that a 15% drop is expected, not a crisis. This shared understanding prevents mid-decline arguments and keeps everyone committed to the long-term strategy.
Final Words
We covered what maximum drawdown measures, the biggest percentage drop from a portfolio peak to its trough, and why that peak-to-trough view shows real downside risk.
You saw the basic formula, numeric examples, common calculation methods, and practical benchmarks for conservative, moderate, and aggressive portfolios. We also showed how to compare strategies, set limits, and stress-test plans.
Use the max drawdown meaning and how to use it to set clear risk limits, size positions, and stay steady in down markets. Small steps build lasting confidence.
FAQ
Q: How to use maximum drawdown?
A: The maximum drawdown is used to show the largest historical peak-to-trough loss and to set risk limits, size positions, stress-test plans, and choose strategies that match your risk tolerance.
Q: What is a good max drawdown?
A: A good max drawdown depends on your goals: conservative targets 5%–10%, moderate 10%–20%, aggressive 20%–40%. Pick the range that fits your time horizon and emotional comfort.
Q: What does it mean if you have a strategy with maximum drawdown of 3%?
A: A strategy with a 3% maximum drawdown means its worst historical loss was 3% from peak to trough, so it suits conservative goals and usually requires only a small recovery to reach new highs.
Q: What does 4% drawdown mean?
A: A 4% drawdown means the portfolio fell 4% from its peak to trough; reversing that loss needs about a 4.17% gain (4 ÷ 96), illustrating recovery requires a slightly larger percentage rise.