

What if a tiny fee is quietly shaving thousands from your retirement?
Expense ratios are annual fees that mutual funds take out of your returns every day, and small differences compound into big losses over time.
This guide shows how to compare expense ratios step by step, what numbers to check, and simple rules for choosing the cheaper fund that still meets your goals.
Read on to learn the clear, practical moves that protect your savings.
Key Steps to Comparing Mutual Fund Expense Ratios Effectively

An expense ratio is an annual fee covering a fund’s operating costs: management, marketing, distribution, and admin work. You won’t see it on an invoice. It’s pulled from your fund’s returns automatically, deducted from net asset value every single day. A 1.00% expense ratio means you pay $10 per year on every $1,000 invested. A 0.05% ratio? Just 50 cents per $1,000, or $5 on a $10,000 investment.
The math is simple. Divide the fund’s annual operating expenses by total assets under management. The result usually shows up as a percentage and in basis points. One basis point equals 0.01%, so 100 basis points equals 1.00%. A 40-basis-point fee is 0.40%. A 3-basis-point fee is 0.03%. These fees compound over time, so small differences turn into thousands of dollars over decades.
To compare expense ratios properly and dodge expensive mistakes:
- Pull the fund’s prospectus from the fund company’s website or your broker’s fund page. The fee table is in the first few pages.
- Write down the stated expense ratio and check whether it includes 12b-1 distribution fees or other embedded charges.
- Confirm the fund type: equity versus bond, index versus actively managed. Note the exact share class, because different classes (A, C, I) of the same fund charge different fees.
- Compare the expense ratio only to funds in the same category. For example, compare equity index funds to equity index averages (around 0.05%) and active mutual funds to the active average (around 0.65%).
- Include any additional plan fees, such as 401(k) administrative charges, sales loads, or trade commissions.
- If you find a similar fund with a materially lower expense ratio and comparable holdings, consider switching to reduce long-term drag.
These six steps form the foundation for evaluating any mutual fund’s cost. Stick to like-for-like comparisons and include all fee layers. You’ll see the real cost of ownership and make smarter choices that compound in your favor.
Understanding Expense Ratios and What They Include
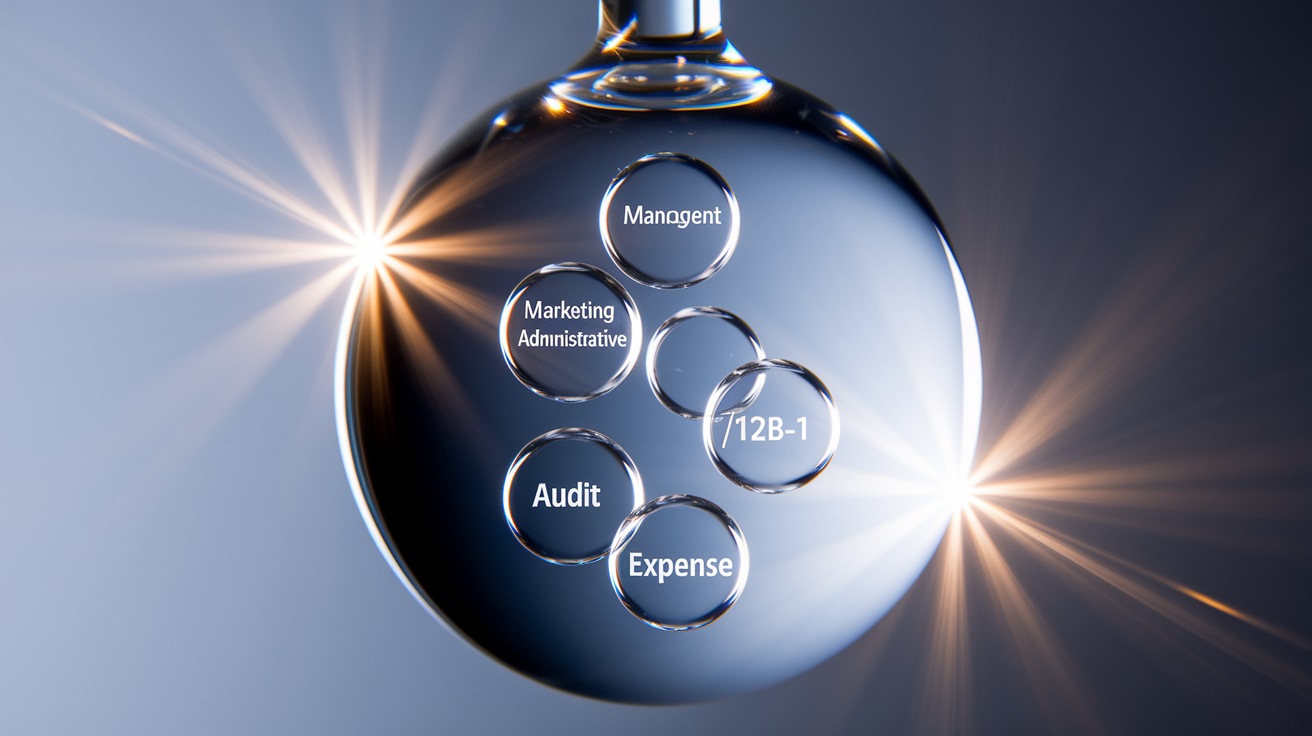
Expense ratios aren’t a single line item. They bundle together several operating costs that keep the fund running. Understanding which expenses fall inside the ratio helps you spot hidden fees and evaluate whether a high expense ratio is actually justified.
The major components inside a typical expense ratio:
Management fees – Compensation for portfolio managers and analysts who pick and oversee the fund’s holdings.
Administrative fees – Costs for record-keeping, shareholder services, custodian services, and legal/compliance work.
Marketing and distribution (12b-1) fees – Charges to cover advertising, broker compensation, and distribution costs. These can add up to roughly 1.00% and are embedded in the expense ratio.
Audit and regulatory expenses – Costs for external audits, legal filings, and meeting regulatory reporting requirements.
Some funds report both a gross expense ratio and a net expense ratio. The gross figure shows what the fund would charge if all fees applied in full. The net figure reflects any temporary waivers or fee reimbursements the fund company has agreed to absorb. A waiver might lower your cost today, but it usually expires after a set period, sometimes just one year. Always check the prospectus to see when a waiver ends and what the full gross expense ratio will be once it does. If you’re comparing two funds and one lists a low net ratio due to a waiver that expires in six months, that fund may become more expensive than the alternative as soon as the waiver lifts.
How Mutual Fund Expense Ratios Are Calculated

The expense ratio formula divides the fund’s total annual operating expenses by its average assets under management. If a fund has $500 million in assets and spends $2.5 million per year on management, admin, marketing, and compliance, the expense ratio is $2.5 million ÷ $500 million = 0.005, or 0.50%.
Investment professionals often express expense ratios in basis points to make comparisons easier. One basis point equals one hundredth of a percent, so 100 basis points equal 1.00%. Here’s how the conversions look:
| Basis Points | Percentage |
|---|---|
| 5 bps | 0.05% |
| 40 bps | 0.40% |
| 75 bps | 0.75% |
The expense ratio covers explicit operating costs that appear in fund accounting, but it doesn’t include portfolio turnover costs. Those are the trading commissions and market-impact costs incurred when the fund buys and sells securities. High-turnover funds can rack up significant transaction expenses that reduce your net returns but never show up in the stated expense ratio. When you’re comparing two funds with similar expense ratios, check the turnover ratio as well. A fund with 100% annual turnover will incur more hidden costs than a fund with 10% turnover.
Benchmarks for Comparing Expense Ratios Across Fund Types
You can’t judge whether an expense ratio is high or low in a vacuum. A 0.50% ratio might be excellent for one type of fund and terrible for another. Benchmarking against category averages gives you the context to spot good deals and avoid overpriced products.
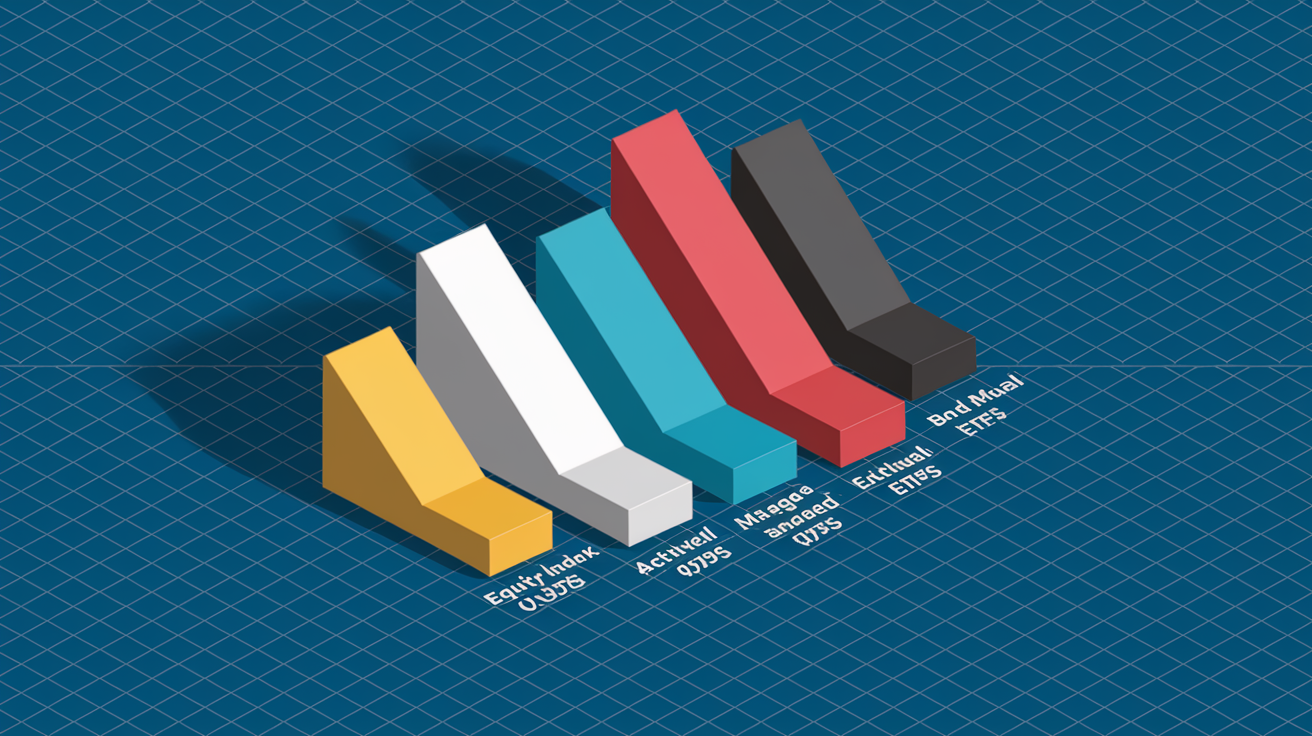
Industry data shows clear patterns by fund type. Passive index funds that simply track a benchmark have very low operating costs because they require minimal research and trading. Actively managed funds employ teams of analysts and make frequent trades, so their expense ratios are higher. Bond funds generally cost less to manage than equity funds, and exchange-traded funds (ETFs) often have lower expense ratios than mutual funds in the same category.
| Fund Type | Typical Expense Ratio Range |
|---|---|
| Equity index mutual funds | ~0.05% |
| Actively managed equity mutual funds | ~0.65% |
| Equity index ETFs | ~0.15% |
| Actively managed ETFs | ~0.43% |
| Bond mutual funds | ~0.37% |
| Bond ETFs | ~0.11% |
Sector-specific, thematic, or emerging-market funds often charge between 0.50% and 2.00% because they require specialized expertise and may invest in less liquid markets. Some niche or leveraged ETFs exceed 1.00%. Use these benchmarks as your starting point. If a fund’s expense ratio sits well above the average for its category, demand clear evidence that the extra cost delivers extra value. Comparing an active fund’s 0.65% ratio to an index fund’s 0.05% ratio might seem unfair at first, but if both funds give you broad U.S. equity exposure, the comparison is valid. You’re paying 0.60% more per year for active management, so you should expect better net returns to justify that cost.
Where to Find a Fund’s Expense Ratio (Prospectus, Broker Pages, Plan Portals)

Every mutual fund and ETF is required by the SEC to disclose its expense ratio in a standard fee table, which makes finding the number straightforward once you know where to look. The prospectus is the official, legally binding document, and the fee table typically appears in the first few pages under a section called “Fees and Expenses” or “Shareholder Fees.”
You can find the prospectus on the fund company’s website by searching for the fund’s ticker symbol or name. Most brokers and retirement-plan portals also display the expense ratio on each fund’s information page, often in a summary box alongside other key facts like inception date, total assets, and minimum investment. If you hold the fund in a 401(k) or similar plan, your plan’s website will list the expense ratio for each available option, usually in a comparison table or fund factsheet.
Primary sources for expense-ratio information:
Fund prospectus – The authoritative source. The fee table breaks down management fees, 12b-1 fees, and other expenses, plus any temporary waivers.
Broker or plan fund information page – Quick reference for the net expense ratio and share-class details. Confirm the data matches the prospectus.
Annual and semiannual shareholder reports – These reports provide detailed expense breakdowns and show actual costs incurred over the reporting period.
Always cross-check the prospectus fee table if you see a surprisingly low expense ratio on a broker page. That low figure might reflect a temporary waiver that will expire. The prospectus will tell you the gross expense ratio (what you’ll pay after the waiver ends) and the duration of any fee reimbursement agreement.
Measuring the Long‑Term Compounding Impact of Expense Ratios
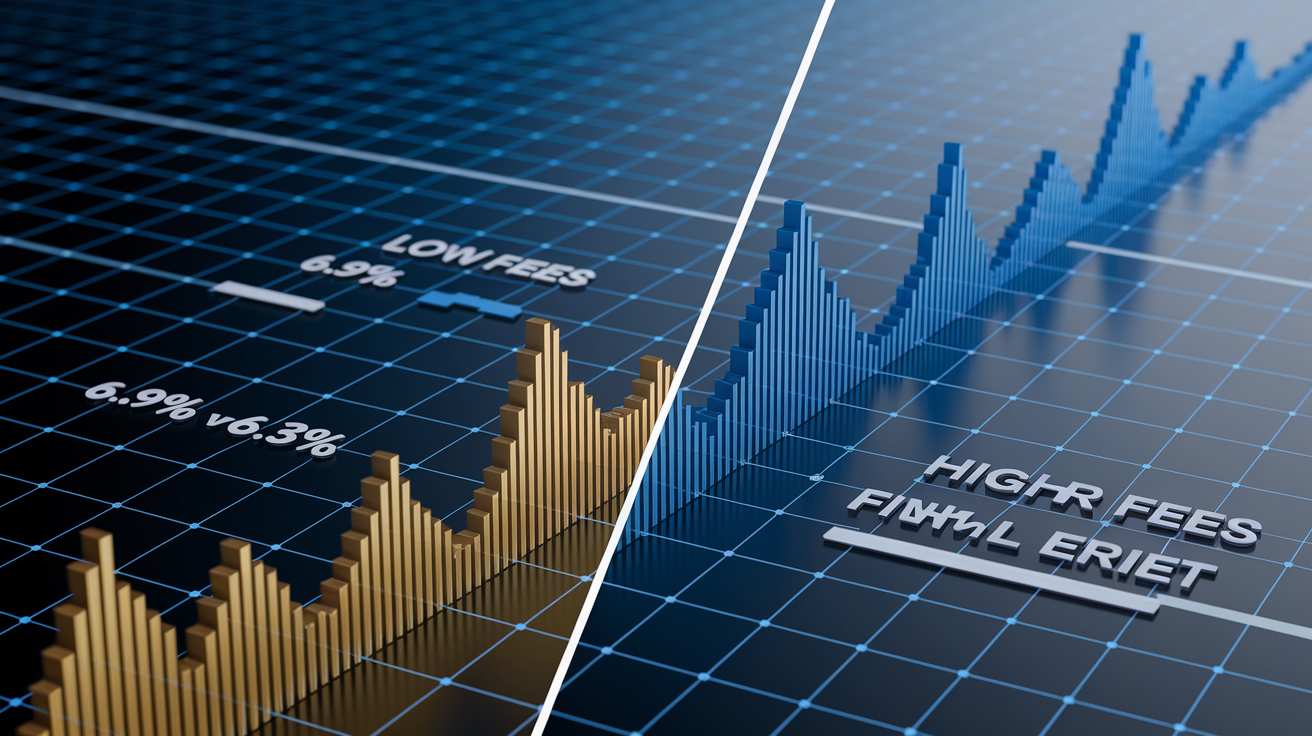
Expense ratios are deducted continuously, typically calculated daily and taken from the fund’s net asset value, so they reduce your returns every single day. That reduction compounds over time. To estimate the impact, subtract the expense ratio from the fund’s expected gross return. If a fund is likely to earn 7.00% per year before fees and charges a 0.05% expense ratio, your net return will be roughly 6.95%. If another fund with the same 7.00% gross return charges 0.65%, your net return drops to about 6.35%.
That 0.60 percentage-point difference sounds small in one year, but compounding magnifies it. Over a 30-year retirement savings period, the gap becomes enormous. Investing $10,000 at a net 6.95% annual return (0.05% expense ratio) grows to approximately $75,000 after 30 years. The same $10,000 at a net 6.35% return (0.65% expense ratio) grows to only about $63,500. A difference of roughly $11,500.
Another illustration: $100,000 invested at 7.00% gross for 30 years with a 1.00% expense ratio ends up near $574,000, while a 0.20% expense ratio yields around $720,000. A $146,000 difference.
To calculate fee drag on your own portfolio:
- Look up each fund’s gross expected return (historical average or forward estimate) and its expense ratio.
- Subtract the expense ratio from the gross return to get your estimated net annual return.
- Use a compound-interest calculator or spreadsheet to project the ending value of your investment over your time horizon at both the lower and higher expense ratios.
- Compare the two ending values to see the dollar cost of higher fees.
Even a seemingly minor 0.50% or 1.00% annual fee difference can reduce your retirement nest egg by tens or even hundreds of thousands of dollars over a multi-decade career. This is why comparing funds based on after-fee returns, not just gross performance or star ratings, is essential. The lower the expense ratio, the more of the fund’s gross returns you keep, and the more those returns compound in your favor instead of the fund company’s.
Red Flags That Indicate Excessive Mutual Fund Expense Ratios

Not all high expense ratios are unjustified, but certain warning signs suggest you’re paying too much for what you’re getting. If you spot any of these red flags, it’s time to investigate whether a lower-cost alternative would serve you better.
Expense ratio materially above the category average – If an actively managed U.S. equity fund charges 1.50% when the category average is 0.65%, and you see no evidence of sustained outperformance, the extra 0.85% is likely wasted cost.
Embedded 12b-1 distribution fees – These marketing and sales charges can add up to 1.00% to the expense ratio. You’re paying the fund company to advertise and compensate brokers, which provides no direct investment benefit to you.
High sales loads or commissions – Front-end or back-end loads (charges when you buy or sell) combined with a high expense ratio create a double layer of cost. No-load funds with low expense ratios are usually better.
Temporary fee waivers masking a high gross expense ratio – A fund advertising a 0.30% net expense ratio might have a 1.20% gross ratio. Once the waiver expires, your cost quadruples.
Persistent underperformance net of fees – If the fund consistently trails its benchmark or peer group after accounting for the expense ratio, the high fee is clearly not justified by results.
Share-class distinctions also matter. Class A shares often carry front-end sales loads and moderate expense ratios. Class C shares skip the upfront load but charge higher annual expenses and sometimes a deferred sales charge. Class I (institutional) shares typically have the lowest expense ratios but require high minimum investments. If you’re offered a Class C share with a 1.50% expense ratio when the same fund’s Class I share charges 0.50%, and you qualify for Class I, the choice is obvious. Always check which share class you’re buying and whether a lower-cost class is available to you through your broker or retirement plan.
Balancing Cost With Fund Quality and Performance Metrics

Lower fees are almost always better, but the absolute cheapest fund isn’t always the best choice. Sometimes a higher expense ratio is justified if the fund delivers consistent, risk-adjusted outperformance that more than offsets the extra cost. The key question is whether the manager’s skill and the fund’s strategy add enough net value to make the higher fee worthwhile.
For actively managed funds, evaluate long-term, after-fee performance across multiple market cycles. Ideally 5 to 10 years or more. Look at metrics like alpha (excess return versus a benchmark after adjusting for risk) and the Sharpe ratio (return per unit of volatility). A fund that charges 1.00% but consistently generates 2.00% of alpha after fees is a better deal than an index fund charging 0.05% with zero alpha. Check manager tenure as well. If the fund’s strong track record was built by a manager who left two years ago, past performance may not predict future results. Low tracking error matters for index funds. How closely the fund follows its benchmark. A passive fund with high tracking error is failing at its job, even if the expense ratio is low.
Most actively managed funds don’t sustain outperformance over the long term. Performance tends to revert to the mean, and the mean is typically the market index. Since you can buy low-cost index funds that deliver market returns for 0.05% or less, any active fund charging significantly more must prove it can beat that index by enough to cover the fee difference. If it can’t, you’re better off in the cheaper fund. The data show that the majority of active funds fail this test over 10 and 15-year periods, which is why prioritizing low costs is a sensible default strategy for most investors. Only pay higher fees when you have clear, persistent evidence that the extra cost buys you something valuable: better returns, lower risk, or access to an asset class you can’t replicate cheaply on your own.
Tools and Methods for Comparing Expense Ratios Across Multiple Funds

Comparing expense ratios becomes much easier when you use the right tools and organize your data systematically. Online calculators, fund screeners, and simple spreadsheets can all help you model the long-term impact of different fee levels and identify lower-cost alternatives.
Expense-ratio calculators let you input your starting investment, expected return, time horizon, and the expense ratios of two or more funds. The calculator then shows you the projected ending values side by side, making the cost difference concrete. The Vanguard Fund Cost Comparison Tool (https://investor.vanguard.com/tools-calculators/mutual-fund-and-etf-fees-calculator) allows you to compare multiple funds and see how fees compound over time. Fund screeners available through most brokers let you filter by asset class, expense ratio, and other criteria, so you can quickly generate a list of low-cost options in your target category.
| Tool Type | Purpose |
|---|---|
| Expense-ratio calculator | Model compounding impact of different fee levels over your investment horizon |
| Fund screener | Filter and sort funds by expense ratio, asset class, and performance to find low-cost alternatives |
| Prospectus fee table | Verify official expense ratio, share-class differences, and fee waivers |
| Fee-disclosure summary (401(k) plan) | Compare all available funds in your retirement plan on an apples-to-apples basis |
For a do-it-yourself approach, build a simple comparison spreadsheet with columns for fund name, ticker, asset class, expense ratio, any 12b-1 or load fees, and net expense ratio after waivers. Add a column for the category-average expense ratio so you can instantly see which funds are above or below the benchmark. Many brokers now offer commission-free trading on a wide range of ETFs, which reduces trading costs and makes it easier to switch to lower-fee options without triggering extra charges. A well-organized spreadsheet or watchlist keeps all your fund data in one place and makes it easy to spot expensive outliers when you review your portfolio each year.
Strategies to Reduce Fee Drag When Building an Expense‑Aware Portfolio
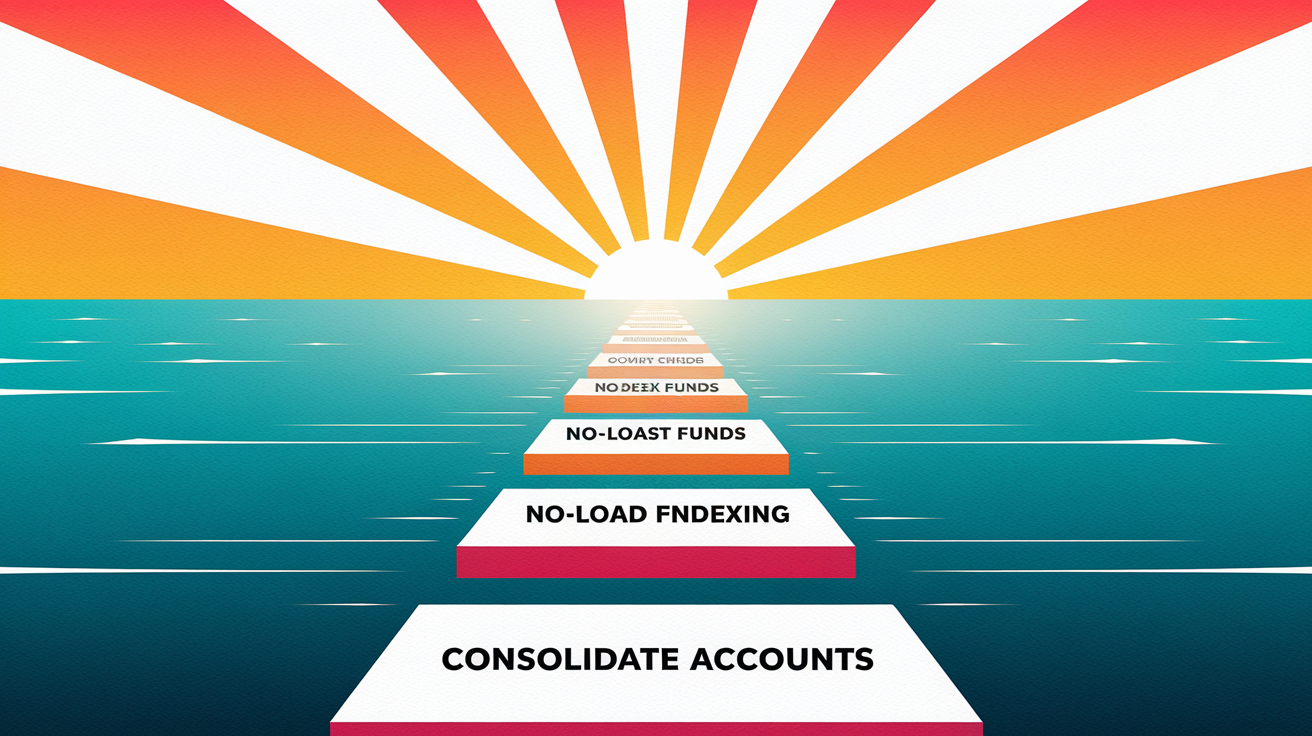
Cutting unnecessary fees is one of the simplest and most reliable ways to improve your long-term investment results. Unlike trying to pick winning stocks or time the market, reducing expenses is entirely within your control and delivers guaranteed savings that compound over time.
Start by prioritizing low-cost index funds and ETFs. Many broad-market equity index funds charge between 0.02% and 0.05%, and bond index funds often come in below 0.10%. If you’re currently holding actively managed funds with expense ratios above 1.00%, consider whether you could get similar diversification and asset-class exposure with passive alternatives at a fraction of the cost. Avoid funds that charge 12b-1 marketing fees. These fees provide no benefit to you and simply transfer wealth from your account to brokers and distributors. Select no-load funds whenever possible to eliminate upfront or deferred sales charges that eat into your initial investment or redemption proceeds.
Key fee-reduction strategies:
Use low-cost index funds and ETFs – Target expense ratios of 0.02% to 0.05% for broad equity exposure and 0.10% or less for bonds.
Avoid 12b-1 fees – Screen out funds with embedded distribution charges. They add cost without adding value.
Consolidate accounts on low-fee platforms – Fewer accounts mean fewer platform fees, and many brokers offer commission-free ETF trading.
Choose no-load funds – Skip front-end and back-end sales loads. Your full investment goes to work immediately.
Consider direct indexing for large portfolios – If you have a substantial balance, owning individual stocks or bonds can eliminate the expense ratio entirely, though you’ll need to manage rebalancing and may incur trading costs.
Research shows that reducing portfolio expenses even modestly, say from 1.00% to 0.20%, can increase the probability of meeting long-term financial goals by a meaningful margin. One case study found that a couple in their 30s with over 20 years until retirement improved their odds of funding all retirement goals from 83% to a higher level simply by lowering their weighted-average expense ratio from around 1.40% to roughly 0.40%. Lower fees mean more money stays invested and compounds in your favor, which directly improves retirement savings durability and gives you a larger cushion against market volatility and unexpected expenses.
Final Words
Start in the action: pull the prospectus, note the expense ratio formula (annual expenses ÷ assets), check share class and any 12b-1 or plan-level fees, and find the ratio on broker pages or shareholder reports.
Benchmark within the same fund category, measure long-term compounding impact with simple calculations, and use screeners or a small spreadsheet to compare multiple funds. Watch for red flags and remember higher fees must earn after-fee gains.
These steps are the practical way to learn how to compare mutual fund expense ratios and build a lower-cost portfolio you can keep for the long run.
FAQ
Q: What is a mutual fund expense ratio?
A: The mutual fund expense ratio is the fund’s yearly operating cost as a percentage of assets, covering management, admin, audit/legal and sometimes 12b-1 distribution fees, and is deducted daily from NAV.
Q: How is the expense ratio calculated?
A: The expense ratio is annual fund expenses divided by assets under management, shown in basis points (100 bps = 1%). Example: 1.00% costs $10 per $1,000 per year.
Q: Where can I find a fund’s expense ratio?
A: You find a fund’s expense ratio in the prospectus “Fee Table,” on broker or plan fund pages, and in annual or semiannual shareholder reports; the prospectus is the authoritative source.
Q: How do expense ratios affect long-term returns?
A: Expense ratios reduce net returns because fees are taken daily and compound over time; small differences (for example 0.05% vs 0.65%) can cost tens of thousands over decades.
Q: What benchmarks should I use to compare expense ratios?
A: Typical benchmarks: equity index mutual funds ~0.05%, active equity ~0.65%, bond mutual funds ~0.37%, equity index ETFs ~0.15%, sector/thematic funds often 0.5–2%.
Q: How do I compare expense ratios effectively?
A: To compare expense ratios effectively, 1) get the prospectus, 2) confirm fund type/share class, 3) check 12b-1 and gross/net, 4) compare like-for-like, 5) add plan-level fees, 6) benchmark averages.
Q: What is the difference between gross and net expense ratios and why check waivers?
A: The gross vs net expense ratio shows pre- and post-waiver costs; the net reflects temporary fee waivers, so check both because waivers can expire and raise future expenses.
Q: What are red flags that a fund’s fees are excessive?
A: Red flags include fees above the category average, 12b-1 distribution fees or sales loads, high turnover, temporary waivers hiding true costs, and persistent underperformance after fees.
Q: When are higher expense ratios justified?
A: Higher expense ratios may be justified if a fund delivers consistent net-of-fee outperformance, strong risk-adjusted returns, low tracking error, and proven manager skill over time.
Q: How can I reduce fee drag when building a portfolio?
A: To reduce fee drag, favor low-cost index or no-load funds, avoid 12b-1 fees, consolidate accounts to cut platform fees, and consider direct indexing only for large portfolios.
Q: Do expense ratios include transaction costs from turnover?
A: Expense ratios generally exclude trading and implicit transaction costs from turnover; those costs still reduce returns, so factor turnover and tax impacts into your evaluation.
Q: What tools help compare expense ratios across funds?
A: Useful tools include fund screeners, expense-ratio calculators, third-party fee analysis, provider tools like Vanguard’s fee calculator, and a simple spreadsheet to compare after-fee projections.